Indicators: DecEMA_StDev
You are missing trading opportunities:
- Free trading apps
- Over 8,000 signals for copying
- Economic news for exploring financial markets
Registration
Log in
You agree to website policy and terms of use
If you do not have an account, please register
DecEMA_StDev:
The DecEMA indicator with additional trend strength indication using colored dots based on the standard deviation algorithm.
If the standard deviation of the DecEMA indicator is between the dK1 and dK2 parameter values, then a small colored dot appears on the moving average. Its color corresponds to the current trend direction.
If the standard deviation becomes higher than the dK2 input parameter value, then the dot size increases. Thus, we get 3 levels of trend strength indication.
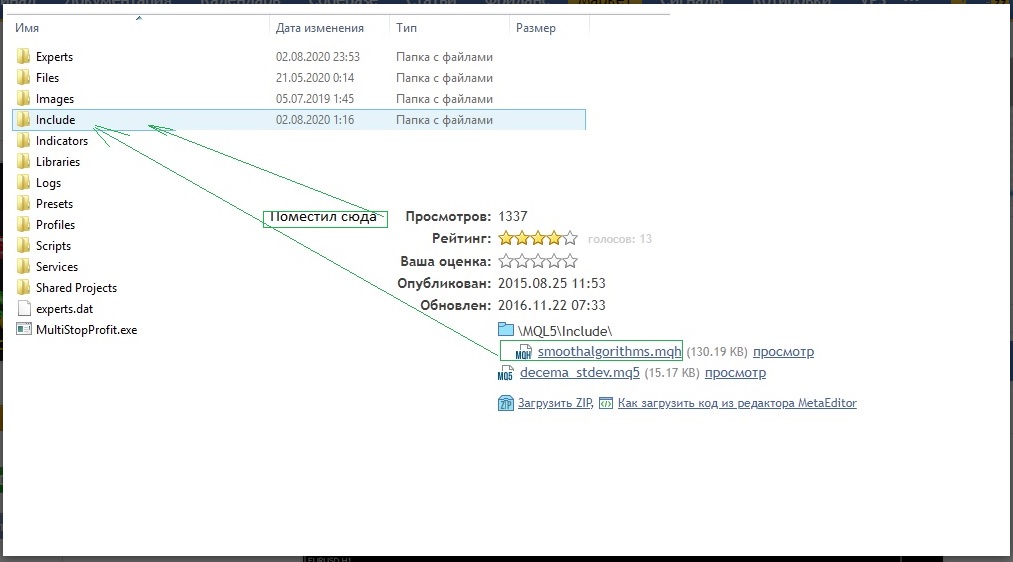
The indicator uses the classes of SmoothAlgorithms.mqh library (copy it to <terminal_data_folder>\MQL5\Include). The use of the classes was thoroughly described in the article "Averaging Price Series for Intermediate Calculations Without Using Additional Buffers".
Fig.1. The DecEMA_StDev indicator
Author: Nikolay Kositsin