Indicators: FP channel
How to Trade Gold Yearly Pivot Points (adapted from dailyfx article)
- Commodity pit traders have used pivot points for decades to determine potential support and resistance areas.
- Gold yearly pivot points from 2013 forecasted significant turning points
- Gold is approaching the 2014 central yearly pivot point at 1360.82
The year 2013 was not very kind to the shiny metal. Gold plunged 27% or just over $450/oz. in one of the biggest declines in many years. However, after hitting a three year low of 1178.86 back in December 2013, gold has managed to crawl back higher in 2014.Yearly pivots marked gold's decline with pinpoint accuracy.
Gold 2013 Yearly Pivots :
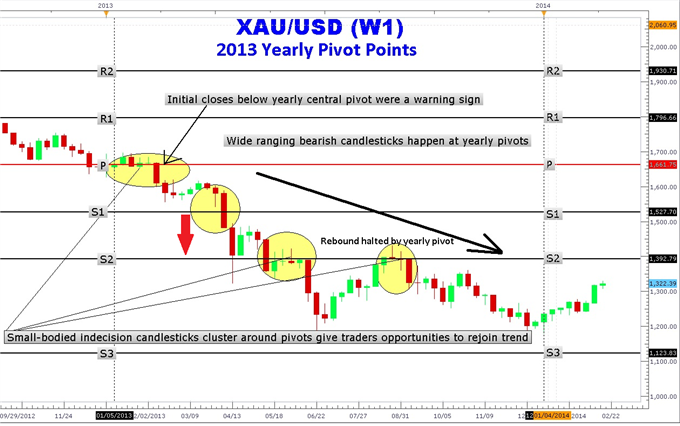
The sudden and severe $141/oz. drop in gold in the beginning of 2013 caught many gold traders off guard. However, traders who watched gold yearly pivots knew ahead of time that a close below the central pivot (P) at $1661.75/oz.
Notice in the chart above how price hugged the central pivot red line. The close below the yearly central pivot marked the beginning of a year-long decline to 3-year lows.
Even after reaching a low of 1208, the subsequent gold rally in July was stopped dead in its tracks at the S2 yearly pivot at $1392.79/oz. Gold went on to make the low of the year at 1179.86. Yearly pivots were useful for determining the beginning of the decline as well as locating areas to re-enter or add more to a position. You may now be wondering what the 2014 yearly pivots have in store for gold.
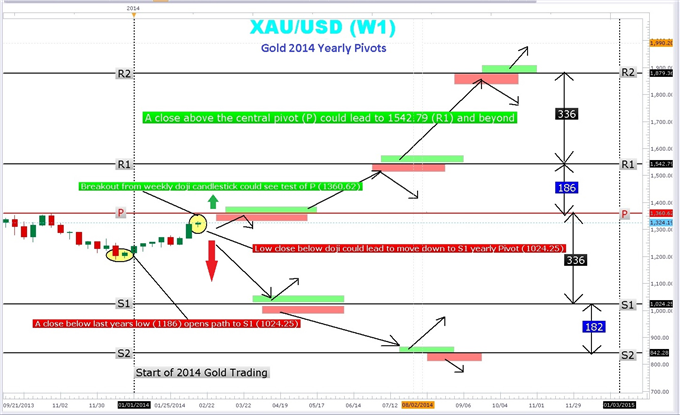
Gold 2014 Yearly Pivots :
Gold Yearly Pivot Trading Plan
Gold starts 2014 higher than where it left off in 2013. Crossing above the psychologically important $1300 level, gold is a long way from the lofty highs in the $1900 area. The first major yearly pivot hurdle is just $40.00 away at the central yearly pivot at 1360.82. This was also the highs of October 2013. Pivot points often act as magnets “pulling” price up or down to the nearest pivot.
The current weekly Japanese candlestick pattern is an indecision doji/spinning top. This gives us a “fork in the road” or decision point; price could break higher or lower from this point and continue to trend in the breakout direction. A new candle is due out next Monday and if it can break above the 1332 high of the doji candle could lead to an explosive move toward the R1 pivot and beyond. Moves above the central pivot are regarded as bullish.
On the other hand, a break below 1307.26 low of the weekly doji candle opens move toward the lows of 2013 in the 1186 area and a test of the S1 yearly pivot at 1024.25. Remember that yearly pivots represent potential support and resistance. Using the pivot point calculation on the high low and close of 2013, these levels can be created. Yearly pivot levels can help traders determine price targets for taking profit as well as entry and stop areas.
- Free trading apps
- Over 8,000 signals for copying
- Economic news for exploring financial markets
You agree to website policy and terms of use
FP channel:
Author: Nikolay Kositsin