Libraries: Statistical Functions
How do you implement?
Thank you for interest in my library. Using it is very easy, you mostly operate on 1 dimension arrays.
For example you can easly remove linear trend from time serie with function detrend:
detrend(timeSerie, detrendResultArray);
timeSerie is an array filled with prices and detrendResultArray should be an empty array in which your results will be stored.
Therefore, after function call you will have array with detrended time serie on which you can perform further analysis (for example check if serie is stationary).
For example, assuming that you have array with Currency1 (possibly backward) you can forecast it's next value with:
double detrendedSerie[];
double forecastedValue;

//make Currency1 stored backwards (last value in array is the newest price)
detrend(Currency1, detrendedSerie);

if(dickeyFuller(detrendedSerie)){
  forecastedValue = AR1(detrendedSerie);
}

if(forecastedValue > detrendedSerie[ArraySize(detrendedSerie)-1]){
  //Buy
}else{
  //Sell
}
Another interesting function available is signed integral. Using it in current form is very easy, you just call the function define limits and polynominal degree (it can be small),
to obtain good approximation of given integral. You can also edit "foo" function to integrate functions other than f(x) = x.
How do you implement?
How do you implement?
Glad to hear that you like it! Please paste here a link if you create some EA/Indicator using this library.
Hello Herajika,
I'm trying to replicate the Dickey-Fuller test statistics from the code you shared with other statistical/math software. Specifially, I'm using Wolfram Mathematica for that.
Please consider the data from the original article you've used (from Scribd):
double data[] = {6109.58, 6157.84, 5850.22, 5976.63, 6382.12, 6437.74, 6877.68, 6611.79, 7040.23, 6842.36, 6512.78, 6699.44,
                 6700.20, 7092.49, 7558.50, 7664.99, 7589.78, 7366.89, 6931.43, 5530.71, 5611.90, 6208.28, 6343.87, 6485.84};
In order to get the test statistics using your code, I have removed the comment before the Print function, as can be seen on the code below:
bool dickeyFuller(double &arr[])
  {
// n=25     50     100    250    500    >500
// {-2.62, -2.60, -2.58, -2.57, -2.57, -2.57};
   double cVal;
   bool result;
   int n=ArraySize(arr);
   double tValue;
   double corrCoeff;
   double copyArr[];
   double difference[];
   ArrayResize(difference,n-1);
//---
   for(int i=0; i<n-1; i++)
     {
      difference[i]=arr[i+1]-arr[i];
     }
//---
   ArrayCopy(copyArr,arr,0,0,n-1);
   corrCoeff=correlation(copyArr,difference);
   tValue=corrCoeff*MathSqrt((n-2)/1-MathPow(corrCoeff,2));
//---
   if(n<25)
     {
      cVal=-2.62;
        }else{
      if(n>=25 && n<50)
        {
         cVal=-2.60;
           }else{
         if(n>=50 && n<100)
           {
            cVal=-2.58;
              }else{
            cVal=-2.57;
           }
        }
     }
   Print(tValue); //--- Test statistics ??
   result=tValue>cVal;
   return(result);
  }
As said, I'm more interested on the test statistics itself, instead only on the test conclusion. In this sense, using the code you shared I get:
void OnStart()
  {
//--- SOURCE: http://pt.scribd.com/doc/80877200/How-to-do-a-Dickey-Fuller-Test-using-Excel#
   double data[] = {6109.58, 6157.84, 5850.22, 5976.63, 6382.12, 6437.74, 6877.68, 6611.79, 7040.23, 6842.36, 6512.78, 6699.44,
                     6700.20, 7092.49, 7558.50, 7664.99, 7589.78, 7366.89, 6931.43, 5530.71, 5611.90, 6208.28, 6343.87, 6485.84};
//---
   dickeyFuller(data);
  }
As I'm now printing the line with the test statistics, I get:
-1.719791886975595However, the original article states that the t-statistics is 1.8125.
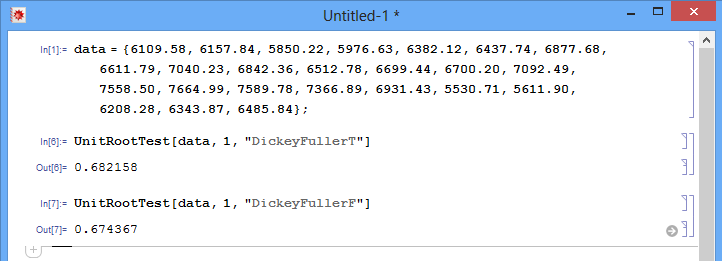
Yet, when I use Wolfram Mathematica on the same data set, I get:
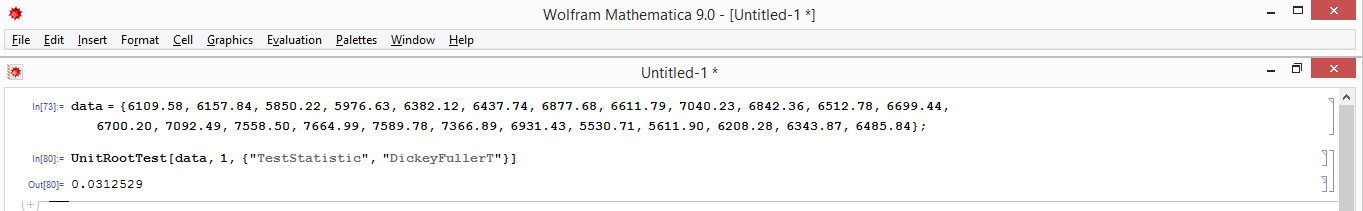
Do you have any idea of what could be the cause of 3 tests giving 3 different test results?
Regards,
Malacarne
Hi! As for difference between result from the article (http://pt.scribd.com/doc/80877200/How-to-do-a-Dickey-Fuller-Test-using-Excel#) and my implementation,
please notice that on the mentioned site, there is some problem with displaing signs (+, -). Therefore, in fact result presened in the article is -1.8125.
As for difference with Wolfram Mathematica, maybe differend implementations use different critical values and calculate tValues differently. Doing the same in Matlab I've got
yet another result (0.6518).
However, if you try the same in excel it should show something close to -1.8125.
Regards,
Herajika
Hello Herajika,
Thanks for the reply. So, in this case, what statistics should be considered the correct one?
Is the original article showing wrong values for the test statistics?
Regards,
Malacarne
P.S.: in Mathematica, if I don't use "TestStatistic" as an option, I get similar results in comparison to MatLab.
- Free trading apps
- Over 8,000 signals for copying
- Economic news for exploring financial markets
You agree to website policy and terms of use
Statistical Functions:
Set of statistical functions which allows you to calculate some values describing timeseries like correlation between two time series, linear regression, standard deviation etc.
Author: Herajika