Why does my 60% win rate mean-reversion setup on gold still lose money?
- How to better filter false entries in trend-following strategies on XAUUSD during volatile periods?
- new to coding, need help
- 100-300 Pips Per Day Any Pair Any Timeframe Using 2 Indicators
Is a 60% win rate with a 1:2 risk/reward just a mathematical illusion? I worked out that I'd need about 67% to break even before spread.
Win rate is not the end-all-be-all metric of a statistical test. For the record, I traded a strategy in the past that merely had a 43% win rate but additional strategic components still allowed it to yield annual profits.
Regarding RR, keep in mind that price only needs to travel a factor of 1 for your set risk to stop you out─while price needs to travel a factor of 2 for your set reward to take profit. If I put 2 horses at the same starting line but one with a 100 meter finish line and the other wish a 200 meter finish line, which one would you put your money on? When isolated as an individual component of your strategy, your set RR inherently means that your stop is twice as likely to be hit as your takeprofit. Consider using custom dynamic exit logic or a trailing stop to allow price indefinite room to run. Personally, I like to use a custom dynamic exit as my main "hidden" stoploss and take profit mechanism, and a fixed server-side stoploss further away from my entry price as a "fail-safe" stop in case of any kind of terminal, pc, internet, or power outage on my end.
A dynamic exit can be a simple as exiting on the first closed down bar for a buy trade and the first close up bar for a sell trade, or based on an indicator such as the Parabolic SAR, Chandelier, etc. Assuming that you've tested on a sufficient sample size of data, your 60% win rate is a solid starting point. You likely just need to do some strategic refinement.
[W]as the dynamic exit the main thing that turned it profitable, or was it more the entry filter?
A combination of both. Specifically, see:
Forum on trading, automated trading systems and testing trading strategies
step-by-step Mobile MT5 instructions needed
Ryan L Johnson, 2026.04.25 23:23
In my efforts to help another trader, I learned that she trades in Mobile MT5 only. This presents a challenge because I only use Mobile MT5 to receive notifications from Desktop MT5 without a trading account connected. I provided my modified "XARD" strategy along with Desktop MT5 chart setup instructions (below). Please help me, help her, set up the chart in Mobile MT5 (if possible) by "converting" my Desktop MT5 instructions into Mobile MT5 instructions─for a very new trader.
Instructions
1. Open XAUUSD, M15 chart.
2. In MT5 Navigator window, go to Indicators==>Examples==>Custom Moving Average. ("factory" MA indicator can be used instead)
3. Drag Custom Moving Average onto chart.
4. Input Period = 13.
5. Input Method = Exponential. (EMA)
6. Click OK.
7. In MT5 Navigator window, go to Indicators==>Examples==>Custom Moving Average. ("factory MA indicator can be used instead)
8. Drag Custom Moving Average onto chart.
9. Input Period = 50.
10. Input Method = Smoothed. (SSMA)
11. Click OK.
12. Download MACD_Signal_Line from: https://www.mql5.com/en/code/63350 (This is merely the signal line of the "factory" MACD histogram indicator in Desktop MT5==>Indicators==>Oscillators)
13. Right click on, and Copy, MACD_Signal_Line from browser Downloads folder.
14. In MT5, go to File==>Open Data Folder==>MQL5==>Indicators.
15. Right click, and Paste, in Indicators folder.
16. Close Data Folder.
17. Restart MT5.
19. In MT5 Navigator window, go to Indicators==>MACD_Signal_Line.
20. Drag MACD_Signal_Line onto chart.
21. Click OK.
Strategy
XAUUSD
M15
EMA (13)
SSMA (50)
MACD Signal Line (12, 26, 9)
Buy entry: EMA crosses above SSMA from below AND MACD Signal Line is above 0 level AND MACD Signal Line slope points up.
Exit: Price crosses below EMA from above.
Sell entry: EMA crosses below SSMA from above AND MACD Signal Line is below 0 level AND MACD Signal Line slope points down.
Exit: Price crosses above EMA from below.

Notes
Of course, anyone who wants to test/use the strategy in Desktop MT5 can simply use it as posted herein.
[D]o you test your exits against random entries too?
No. As shown in my strategy above, my dynamic exit is generally a faster "stripped down" component of my more comprehensive entry components. I can only imagine that randomizing entries could only do violence to the entire strategy.
A combination of both. Specifically, see:
No. As shown in my strategy above, my dynamic exit is generally a faster "stripped down" component of my more comprehensive entry components. I can only imagine that randomizing entries could only do violence to the entire strategy.
Thanks for sharing the full rules, that’s really generous. I’ll run it through the same tests on XAUUSD M15 (2016–2026, real spread) and post the results here, both as posted and with a fail-safe stop.
On the random-entry point: I don’t mean randomizing your strategy itself. It’s a benchmark. I keep your exact entry times and your exact exit rule, and only flip the trade direction at random. If the real direction does clearly better than the coin-flip version, that shows the entry logic has a real edge. If both come out about the same, the results are mostly coming from the exit and the market’s behavior rather than from the signal. It’s just a way to measure how much each component contributes.
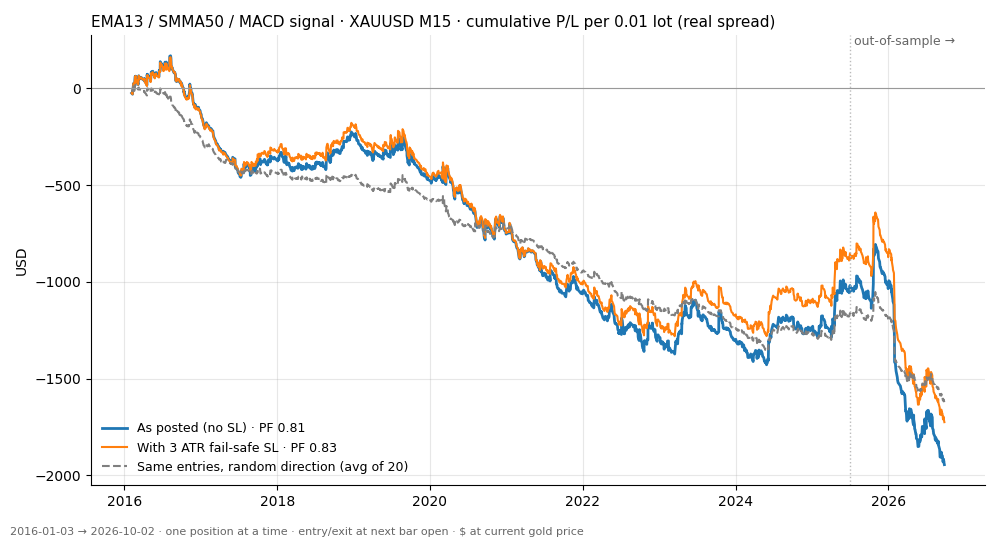
Thanks again for sharing your rules. I ran them as a quick mechanical test and attached the equity curve.
[attach: xard_equity.png]
Setup: XAUUSD M15, 2016 – Oct 2026, real spread, one position at a time, entry and exit at the next bar open after the signal.
What I got:
- About 0.6 trades per day, a 29% win rate, and an average win roughly 2× the average loss
- Profit factor about 0.8, both before and after mid-2025
- Adding a 3 ATR fail-safe stop barely changed anything, because the EMA exit almost always comes first
- The dashed line is the same entries and the same EMA exit with a random direction. It tracks the real curve quite closely.
I’m sure this doesn’t capture everything you do, so I’d really value your view on a few things:
- Is something missing from the mechanical version? For example, do you skip crosses that happen in a tight range, or only take them in certain sessions?
- The EMA(13) exit: do you exit on the first close across it, or do you wait for some confirmation? I suspect a lot of the small losses come from quick whipsaws back across the EMA.
- The MACD condition: do you need the signal line to have just turned, or is any upward slope at the moment of the cross enough?
- Your live results vs. a backtest like this: in your experience, does discretion improve on the pure rules, or do the rules alone hold up?
I’m happy to re-run with any changes you suggest and post the new curve. It’s interesting to see how much each piece contributes.
Thanks for sharing the full rules, that’s really generous. I’ll run it through the same tests on XAUUSD M15 (2016–2026, real spread) and post the results here, both as posted and with a fail-safe stop.
You're welcome. 10 years of real ticks with real spread is quite the workload. Your detailed results should be interesting.
On the random-entry point: I don’t mean randomizing your strategy itself. It’s a benchmark. I keep your exact entry times and your exact exit rule, and only flip the trade direction at random. If the real direction does clearly better than the coin-flip version, that shows the entry logic has a real edge. If both come out about the same, the results are mostly coming from the exit and the market’s behavior rather than from the signal. It’s just a way to measure how much each component contributes.
Got it. Well in this case, the dynamic exit would likely close an inverted trade at the moment that trade was opened─because one inverted entry condition is the dynamic exit. I mean, I just don't see how it would work.
You're welcome. 10 years of real ticks with real spread is quite the workload. Your detailed results should be interesting.
Got it. Well in this case, the dynamic exit would likely close an inverted trade at the moment that trade was opened─because one inverted entry condition is the dynamic exit. I mean, I just don't see how it would work.
Good catch, and you’re right. I checked, and with your exit, a flipped trade is usually closed on the very next bar, because price is already on the “wrong” side of the EMA for the flipped direction. So a direction-flip benchmark isn’t a fair comparison for a strategy where the exit is tied to the entry condition. Thanks for pointing it out.
The absolute results don’t depend on that benchmark, so they still stand. Taken mechanically, the posted rules came out at around PF 0.8 with a 29% win rate (equity curve attached earlier).
A fairer benchmark for your strategy would be to keep your exit, but enter at random times in the direction price already sits relative to the EMA(13): long if above, short if below. That would show how much the EMA/SMMA cross plus the MACD condition add over simply “being on the right side of the EMA”. I’ll run that version and post it.
Is something missing from the mechanical version? For example, do you skip crosses that happen in a tight range, or only take them in certain sessions?
No range filtering. Just don't trade 1 hour prior to the daily close nor 1 hour after.
The EMA(13) exit: do you exit on the first close across it, or do you wait for some confirmation? I suspect a lot of the small losses come from quick whipsaws back across the EMA.
Yeah, I was unclear in that other thread. Trade only on bar close.
The MACD condition: do you need the signal line to have just turned, or is any upward slope at the moment of the cross enough?
For a buy, the last MACD Signal Line position must be higher than its previous position, and the the last MACD Signal Line position must be higher than the indicator's 0 level. Invert for a sell.
There is an updated version of the MACD Signal Line indicator in the CodeBase, "MACD_Signal_Line_color", that automatically combines both of those conditions into corresponding color changes:
MACD Signal Line indicator for MT5
Ryan L Johnson, 2025.09.03 18:52
A stripped-down and colorized (signal line only) version of Metaquotes' MACD indicator from the MT5==>Indicators==>Examples folder.Your live results vs. a backtest like this: in your experience, does discretion improve on the pure rules, or do the rules alone hold up?
No range filtering. Just don't trade 1 hour prior to the daily close nor 1 hour after.
Yeah, I was unclear in that other thread. Trade only on bar close.
For a buy, the last MACD Signal Line position must be higher than its previous position, and the the last MACD Signal Line position must be higher than the indicator's 0 level. Invert for a sell.
There is an updated version of the MACD Signal Line indicator in the CodeBase, "MACD_Signal_Line_color", that automatically combines both of those conditions into corresponding color changes:
Thanks for clarifying. I’ve added the daily-close rule (no entries from 1 hour before the 17:00 New York close until 1 hour after the reopen), confirmed that everything is evaluated on bar close, and kept the MACD signal line condition exactly as you described (last value above the previous one and above 0, inverted for sells).
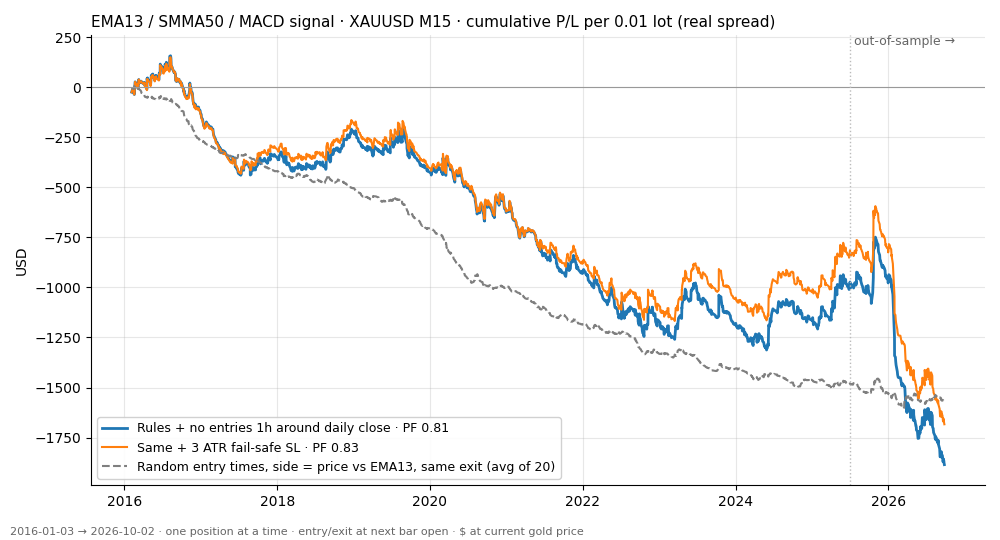
Results (XAUUSD M15, 2016 – Oct 2026, real spread):
- The time filter removed about 5% of trades and didn’t change the result: PF 0.81, 29% win rate, average win about 2× the average loss.
- With the 3 ATR fail-safe stop: PF 0.83.
- Your entries still beat the random-time benchmark from 2016 to 2025 (blue above dashed), but the benchmark itself loses with the same exit.
On the spread point: the average loss per trade comes out at around $0.50 per 0.01 lot. That’s roughly the size of the spread cost per trade, so before costs the system looks close to break-even. With ~0.6 trades a day, spread ends up being the deciding factor. That’s why I’m not fully convinced M15 is high enough here, at least on my broker’s spreads.
A few honest possibilities for why your live experience differs from this test:
- A different period or broker (lower spread or commission)
- Small differences in how the indicators are calculated (for example SMMA seeding, or the MACD signal using SMA vs EMA)
- Your live trades being fewer and more selective than the mechanical rules
If you’re curious, I could run the same rules on H1, or with a slower exit (for example, exit on the opposite EMA/SMMA cross). The entry seems to be the stronger half, so a slower exit might let it show. Which of those would be closest to how you’d want to trade it?
A different period or broker (lower spread or commission)
Most likely, yes. On a relate note, CME 1OZ micro gold futures contracts have a fairly standard 0.25 spread. Technically, that spread is variable but it rarely deviates from 0.25 (while avoiding the daily close). The CME is a centralized exchange that all CME futures broker-dealers share, so everyone gets the same spread, price discovery, order execution priority, and real volume access.
As I noted in the strategy thread, the strategy is a basic version of the rather well known XARD strategy. The slow MA was actually an EMA (not an SMMA) in the original XARD strategy. I altered it to make trading more selective. If were going to change a parameter, I'd start with that one.
If you’re curious, I could run the same rules on H1, or with a slower exit (for example, exit on the opposite EMA/SMMA cross). The entry seems to be the stronger half, so a slower exit might let it show. Which of those would be closest to how you’d want to trade it?
The only problem I can foresee with that is the fact that gold has been unusually rangebound recently. I fear that slowing the exit would only increase stopouts.
On another related note, I've found that a Renko chart having a Renko brick size of 5.00 is good proxy for the M15 timeframe on XAUUSD but much smoother than M15. By breaking all of the bars down into equal sizes, you can get more timely entries and exits based on brick close.

- Free trading apps
- Over 8,000 signals for copying
- Economic news for exploring financial markets
You agree to website policy and terms of use