Discussing the article: "The Mathematics of Volatility: Why the GRI Indicator Deserves to Return to Your Trading Terminal"
I’d ban someone for that :-)
Because there’s no answer to the question posed in the thread, no requests from anyone, just a mad, gloomy wall of code. That’s what a moderator’s pay is like
Amazing writeup SIR!
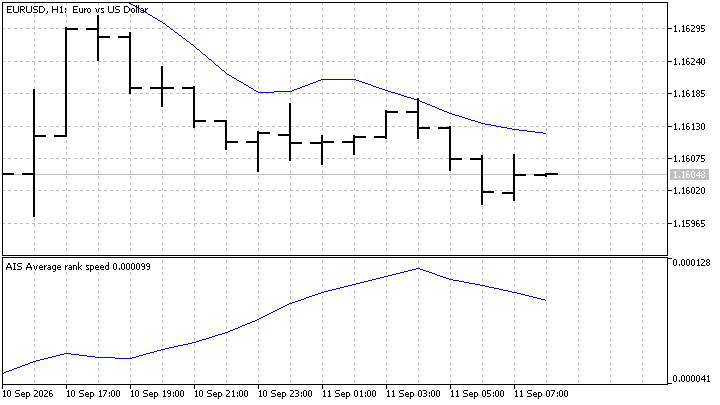
All the same, before using the indicator, it is important to understand its physical meaning. In this indicator, there are logarithms in both the numerator and the denominator. What is stopping us from using exponentiation? This would make the indicator’s meaning clearer – the average Winsorised velocity. We could go even further and measure this velocity across all values in the series. This would then give us a picture like this.

You are missing trading opportunities:
- Free trading apps
- Over 8,000 signals for copying
- Economic news for exploring financial markets
Registration
Log in
You agree to website policy and terms of use
If you do not have an account, please register
Check out the new article: The Mathematics of Volatility: Why the GRI Indicator Deserves to Return to Your Trading Terminal.
In modern trading, it is important not only to determine the direction of price movement, but also to understand how "active" or "chaotic" the market is at any given moment. Many traders find themselves in a situation where standard indicators do not provide a clear answer: whether to expect a strong move or whether the market is in a quiet phase. When looking for a simple and intuitive tool to assess market volatility and the market's "degree of chaos," one option is the Gopalakrishnan Range Index (GRI), also known as the Range of Chaos Index (ROCI).
GRI was first published in January 2001 in the respected journal Technical Analysis of Stocks & Commodities (TASC). Its creator was Jayanthi Gopalakrishnan, a well-known analyst and editor at TASC. At that time, the indicator was proposed as a simple way to quantify the "degree of chaos" (range) of price movement over a given period. Despite its simplicity and clarity, GRI has not gained widespread popularity and is rarely found in modern trading platforms and strategies.
Throughout the history of technical analysis, there have been many tools developed during an era when powerful computers and complex algorithms did not exist. They are characterized by their simplicity, clear logic, and versatility. Indicators such as GRI can be easily implemented in modern trading platforms, and their concepts can be adapted to new market conditions. Sometimes it is precisely the forgotten tools that hold the key to success when standard methods no longer yield the desired results.
Author: Artyom Trishkin