Confusion about OnCalculate's documentation
What does this suppose to tell us:
What they're probably saying is that an indicator can be attached to another indicator's subwindow. Logically, it's hard to call another indicator's subwindow a price chart.
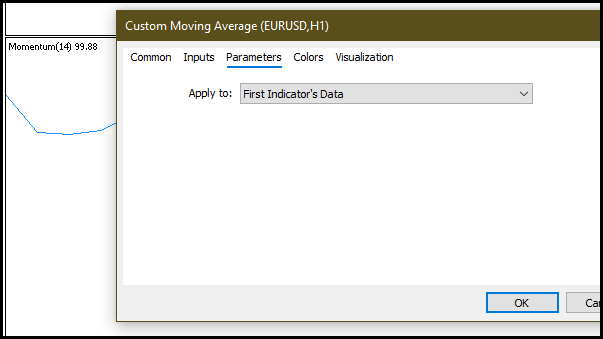
I drop the Custom Moving Average into the Momentum subwindow and apply it to the "First Indicator's Data":
In the Indicator List, it is clearly visible that the MA is attached to another indicator's subwindow, not to the price chart.
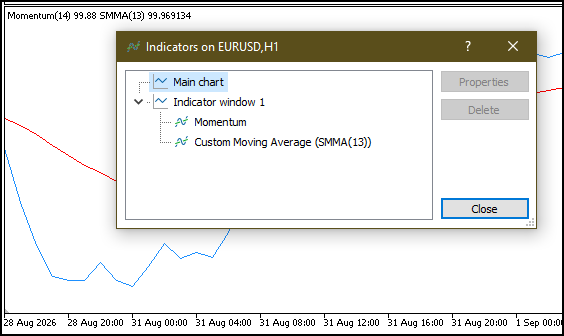
That means OnCalculate() is triggered even if this indicator is not attached to the price chart of the used symbol.
That concerns call by iCustom. You can have the iCustom call in a code running on a chart X, but using symbol Y as parameter in iCustom. OnCalculate will be triggered by ticks on symbol Y not symbol X.
You can call iCustom for any symbol/TF.The indicator does not be attached to any chart.
That means OnCalculate() is triggered even if this indicator is not attached to the price chart of the used symbol.
That concerns call by iCustom. You can have the iCustom call in a code running on a chart X, but using symbol Y as parameter in iCustom. OnCalculate will be triggered by ticks on symbol Y not symbol X.
I agree.
To avoid any further potential confusion, symbol Y must be in the Market Watch window.An expert advisor can use the custom indicator to place trades. It would call iCustom to obtain a handle and then read the buffer or buffers and eventually place trades based on the behaviour of the indicator. So, the expert advisor may be added to the chart but the indicator itself is not added explicitly.

- Free trading apps
- Over 8,000 signals for copying
- Economic news for exploring financial markets
You agree to website policy and terms of use
I'm a bit confused of this documentation found here:
https://www.mql5.com/en/docs/basis/function/events#oncalculate
I quote it here:
"
OnCalculate
The OnCalculate() function is called only in custom indicators when it's necessary to calculate the indicator values by the Calculate event. This usually happens when a new tick is received for the symbol, for which the indicator is calculated. This indicator is not required to be attached to any price chart of this symbol.
This indicator is not required to be attached to any price chart of this symbol."
What does this suppose to tell us:
?
I mean, no indicators are required to be attached to any price chart of any symbol, right ?
Any insight is appreciated.