Possible bug in the ZigZag indicator (MT5)
The standard zigzag is legacy code. You're talking about a zigzag that caches values and self-corrects legs. The longer the depth, the longer it will lag to self correct itself. It's a blind hunter extreme search algorithm.
Metaquotes will not update any of the default terminal indicators. If they would do so, it would cause serious dependency problems as many users could be using these indicators as is inside expert advisors.
Forum on trading, automated trading systems and testing trading strategies
weird behaviour of zigzag indicator
Sac D, 2025.03.01 10:09
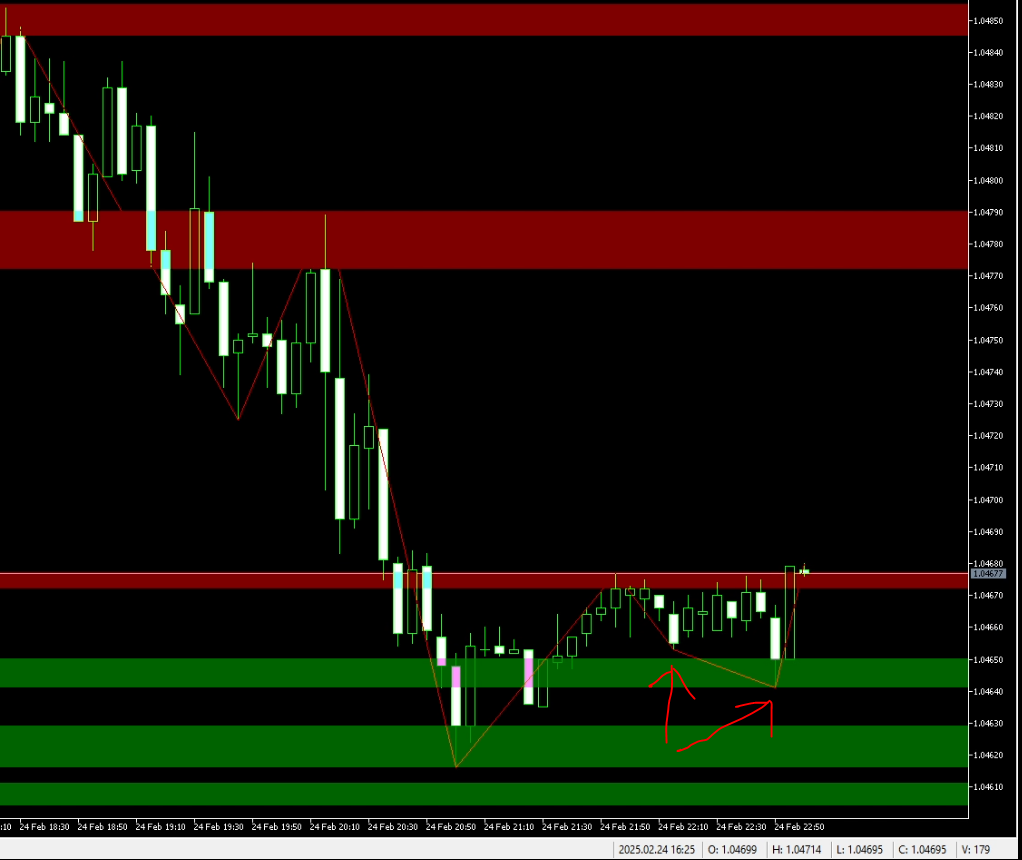
Hey does anyone know why this zigzag indicator is behaving like this. Not marking proper swings?
shown by red arrows.
zigzag values are - 7,5,3
timeframe 5 minute
is there any solution to avoid this fake swings or weird swings?
Forum on trading, automated trading systems and testing trading strategies
weird behaviour of zigzag indicator
Vladislav Boyko, 2025.03.01 12:13
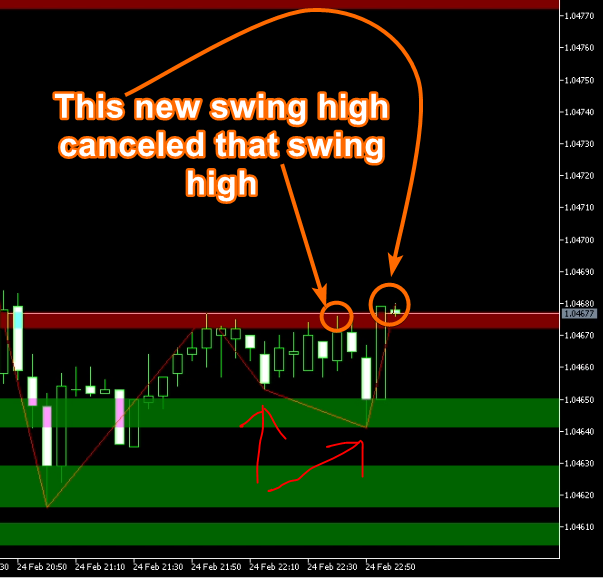
Between those two swing lows there was a swing high that was cancelled. The swing high was canceled because that's how it works, the logic of the zigzag means that a new high can cancel the previous high if it is too close. Nobody can fix that because that's not a bug.
I miss the old forum, where people made an effort to formulate both questions and answers, instead of trying to post AI slop in place of both.
It feels like some people are trying to turn this place into an Moltbook branch. But they won't succeed😁.
Sorry for the off-topic.
I miss the old forum, where people made an effort to formulate both questions and answers, instead of trying to post AI slop in place of both.
It feels like some people are trying to turn this place into an Moltbook branch. But they won't succeed😁.
Sorry for the off-topic.
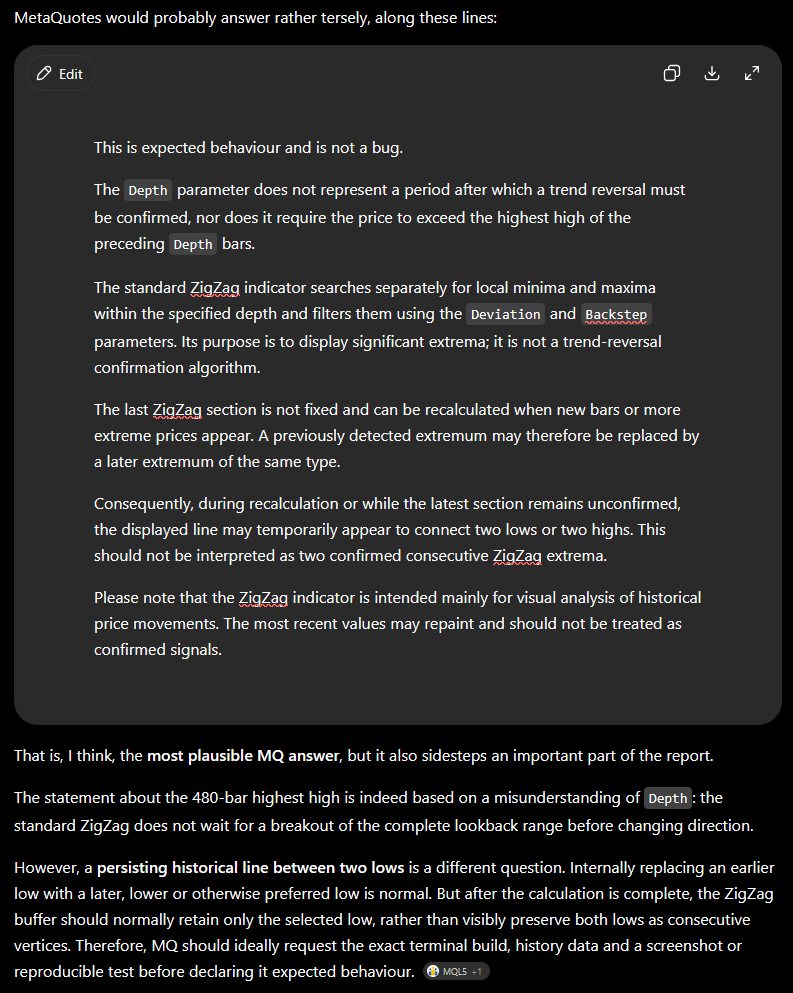
Prompt : "If you were MetaQuotes (MQ), what would you answer to this forum post ?" (followed by the OP post of course).
Answer :
If it might serve you... this was my attempt to modernize the depth based zigzag. It excludes a backstep and only uses Depth and Deviation in the input (though I argue that the Deviation does not really need to be an input parameter at all).
It should never need to self correct any legs, and as such it doesn't do any price caching.
Read my blogs about the original zigzag indicator if you're interested in its shortcomings in technical depthTo Alain Verleyen:
Thank you for sharing MQ explanation regarding the meaning of the Depth parameter. I agree that my interpretation of Depth was not correct.
However, my concern is different.
The issue is not that the last unconfirmed section repaints.
The issue is that, after many subsequent bars have formed, the historical ZigZag still contains a section connecting two consecutive lows, while the intermediate high is omitted (in fact such an intermediate high does not exist).
Is this also considered expected behaviour of the standard ZigZag implementation?
The issue is that, after many subsequent bars have formed, the historical ZigZag still contains a section connecting two consecutive lows, while the intermediate high is omitted (in fact such an intermediate high does not exist).
Is this also considered expected behaviour of the standard ZigZag implementation?
I'm no Alain Verleyen, but this is expected behavior.
If the high isn't fully formed yet and a new high appears, the new high cancels out the previous high. If there was a low between those two highs, then you get a zigzag leg connecting the two lows. See that comment for a better understanding of what I'm talking about in this paragraph.
You could, of course, remove one low in such cases, but that would greatly complicate the algorithm without changing the actual behavior (just the display).
The MetaQuotes documentation states that the indicator connects trend reversal points (significant highs and lows).
"The ZigZag indicator connects trend reversal points (major highs and lows on the price chart) with line segments. The minimum price change parameter defines the number of points the price must move in order to form a new 'Zig' or 'Zag' line. The indicator filters out price fluctuations smaller than the specified value"
However, in this case the historical output shows a segment connecting two consecutive lows.
Is this the expected behaviour? If so, how is it consistent with the definition provided in the documentation?

- Free trading apps
- Over 8,000 signals for copying
- Economic news for exploring financial markets
You agree to website policy and terms of use
Hello MQL Team, or anyone around,
I would like to report what appears to be an issue with the standard ZigZag indicator.
I loaded a ZigZag (Depth = 480, Deviation = 5, Backstep = 3) on the EURUSD H1 chart. A depth of 480 corresponds to approximately 20 trading days (24 hours × 5 trading days per week).
The indicator correctly plotted a downward segment between:
(All times are MetaQuotes-Demo server time.)
From that point onward, however, the indicator unexpectedly draws a new segment directly from that low (1.13240) to the next low formed on 28 July, 13:00 — 1.13533.
This behaviour seems incorrect for two reasons:
Could you please confirm whether this is the expected behaviour of the standard ZigZag algorithm, or whether it is a bug?
Thank you in advance for your assistance.
Kind regards,