Indicators: Ease of Movement
The Ease of Movement indicator is used to show the amount of volume that is necessary to move price. Buy and sell signals are also generated by this indicator.
- High Ease of Movement reading signals that prices rose on low volume and that little volume will be required to change the price of the stock or futures contract in the near term.
- Low Ease of Movement reading signals that prices fell on low volume and that little volume will be required to change the price of the stock or futures contract in the near term.
- Ease of Movement reading around zero signifies that much volume is required to move the price of the stock or futures contract in the near term.
The Ease of Movement calculated value is usually smoothed with a 14-period moving average.
The chart below of the E-mini Nasdaq 100 Futures contract shows an example of the Ease of Movement technical indicator, with buy and sell signals labeled:
Buy when the Ease of Movement indicator crosses above the zero line.
Ease of Movement Sell Signal
Sell when the Ease of Movement indicator crosses below the zero line.
As with most indicators, it is advised that a stock or futures trader use other technical analysis indicators to confirm buy or sell signals.
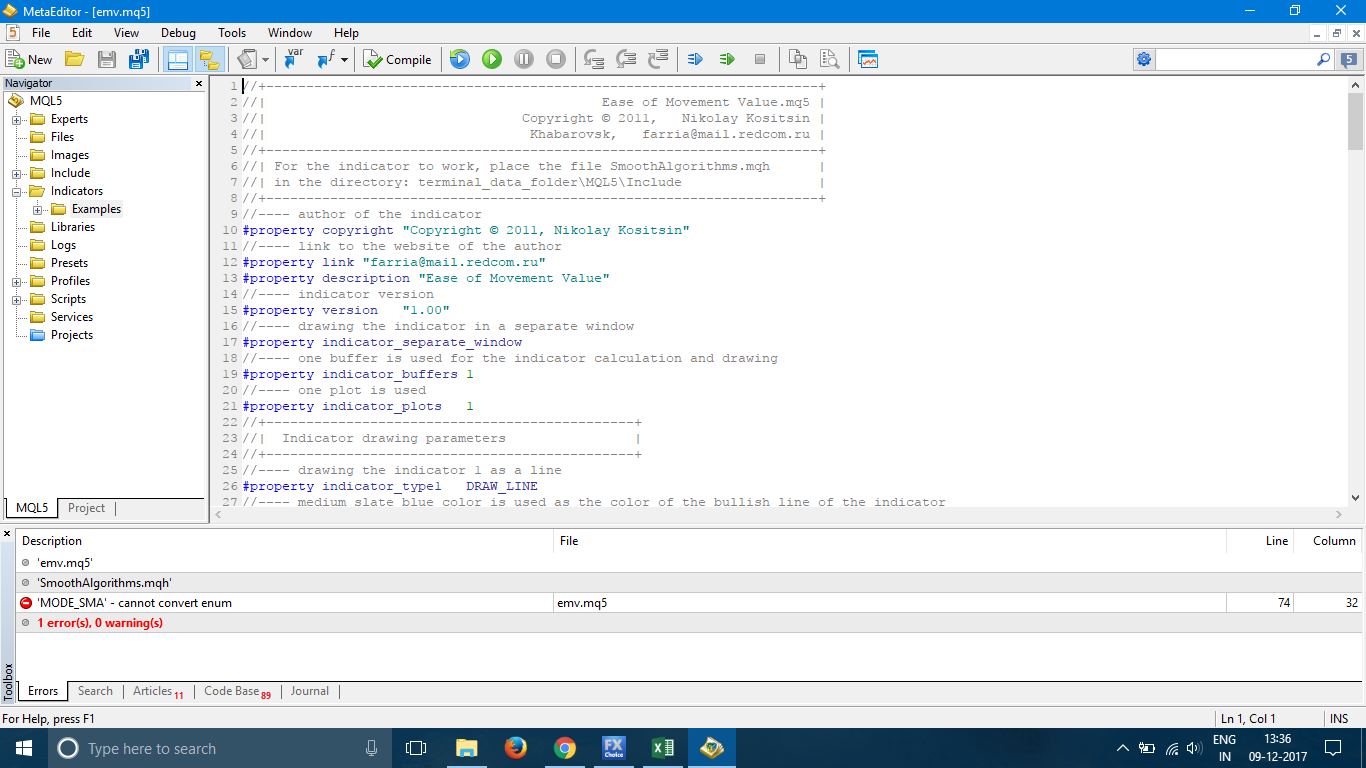
Indicator does not load
Are you sure you downloaded the second file?
//| The SmoothAlgorithms.mqh file should be placed | for the indicator to work
//| to the folder (directory): terminal_data_folder\MQL5\Include |
Hi Mr Nikolay,
The Easy of Movement is not working with new metatrader 5, could you update it please?
Thanks
i can't install it could you tell me step by step how to install it?
- Free trading apps
- Over 8,000 signals for copying
- Economic news for exploring financial markets
You agree to website policy and terms of use
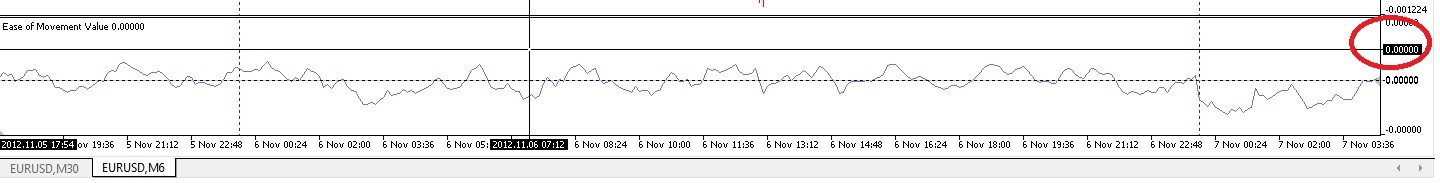
Ease of Movement:
Ease of Movement (EMV) technical indicator is used to display the ratio between prices change rate and market volume.
Ease of Movement was developed by Richard W. Arms, Jr.) who is known as the author of the popular indicator called Arms Index. EMV is calculated as a ratio of the Midpoint Move to the volume parameter (Volume/ High - Low).
As a rule, EMV indicator value is smoothed by a moving average having the smoothing period equal to 14 candlesticks.
Big positive values show that the prices are rising, while the volume is staying low. Big negative values show that the prices are going down, while the volume is staying low.
Signals:
The indicator shows that the lower is the price movement range and the "heavier" is the volume, the less is the movement freedom.
Author: Nikolay Kositsin