Discussing the article: "Building an Object-Oriented Session VWAP Engine in MQL5"
Institutional traders tend to anchor their VWAP's at the most recent major swing high for downside forecasting, and at the most recent major swing low for upside forecasting. In that case, midnight or any specific time is irrelevant. While selection of highs and lows is admittedly subjective, a ZigZag indicator along with logic that waits for confirmation thereof could be used. It would be interesting to see how that would affect your testing results.
Thanks. I have my own time-based AVWAP indicator. You're seriously giving me some ideas:
- I converted an MQL4 "non-repainting ZigZag" indicator to MQL5 some time ago─it's really just LSMA-based. The indicator's lag would be ok because we can't call major swing highs/lows in real-time anyway.
- Assuming that the macro event immediately prints a major swing high/low in the market, anchoring to that time makes sense. Of course, that same event printing a continuation would have to be ignored. A potential alternative might be to simply anchor to a large rejection/reversal bar appearing at a major swing high/low─regardless of the perceived fundamental driver of that bar.
- And it literally just hit me now 💡... to possibly combine #1 and #2 to make an EA readily identify the AVWAP anchor times.
Thanks. I have my own time-based AVWAP indicator. You're seriously giving me some ideas:
- I converted an MQL4 "non-repainting ZigZag" indicator to MQL5 some time ago─it's really just LSMA-based. The indicator's lag would be ok because we can't call major swing highs/lows in real-time anyway.
- Assuming that the macro event immediately prints a major swing high/low in the market, anchoring to that time makes sense. Of course, that same event printing a continuation would have to be ignored. A potential alternative might be to simply anchor to a large rejection/reversal bar appearing at a major swing high/low─regardless of the perceived fundamental driver of that bar.
- And it literally just hit me now 💡... to possibly combine #1 and #2 to make an EA readily identify the AVWAP anchor times.
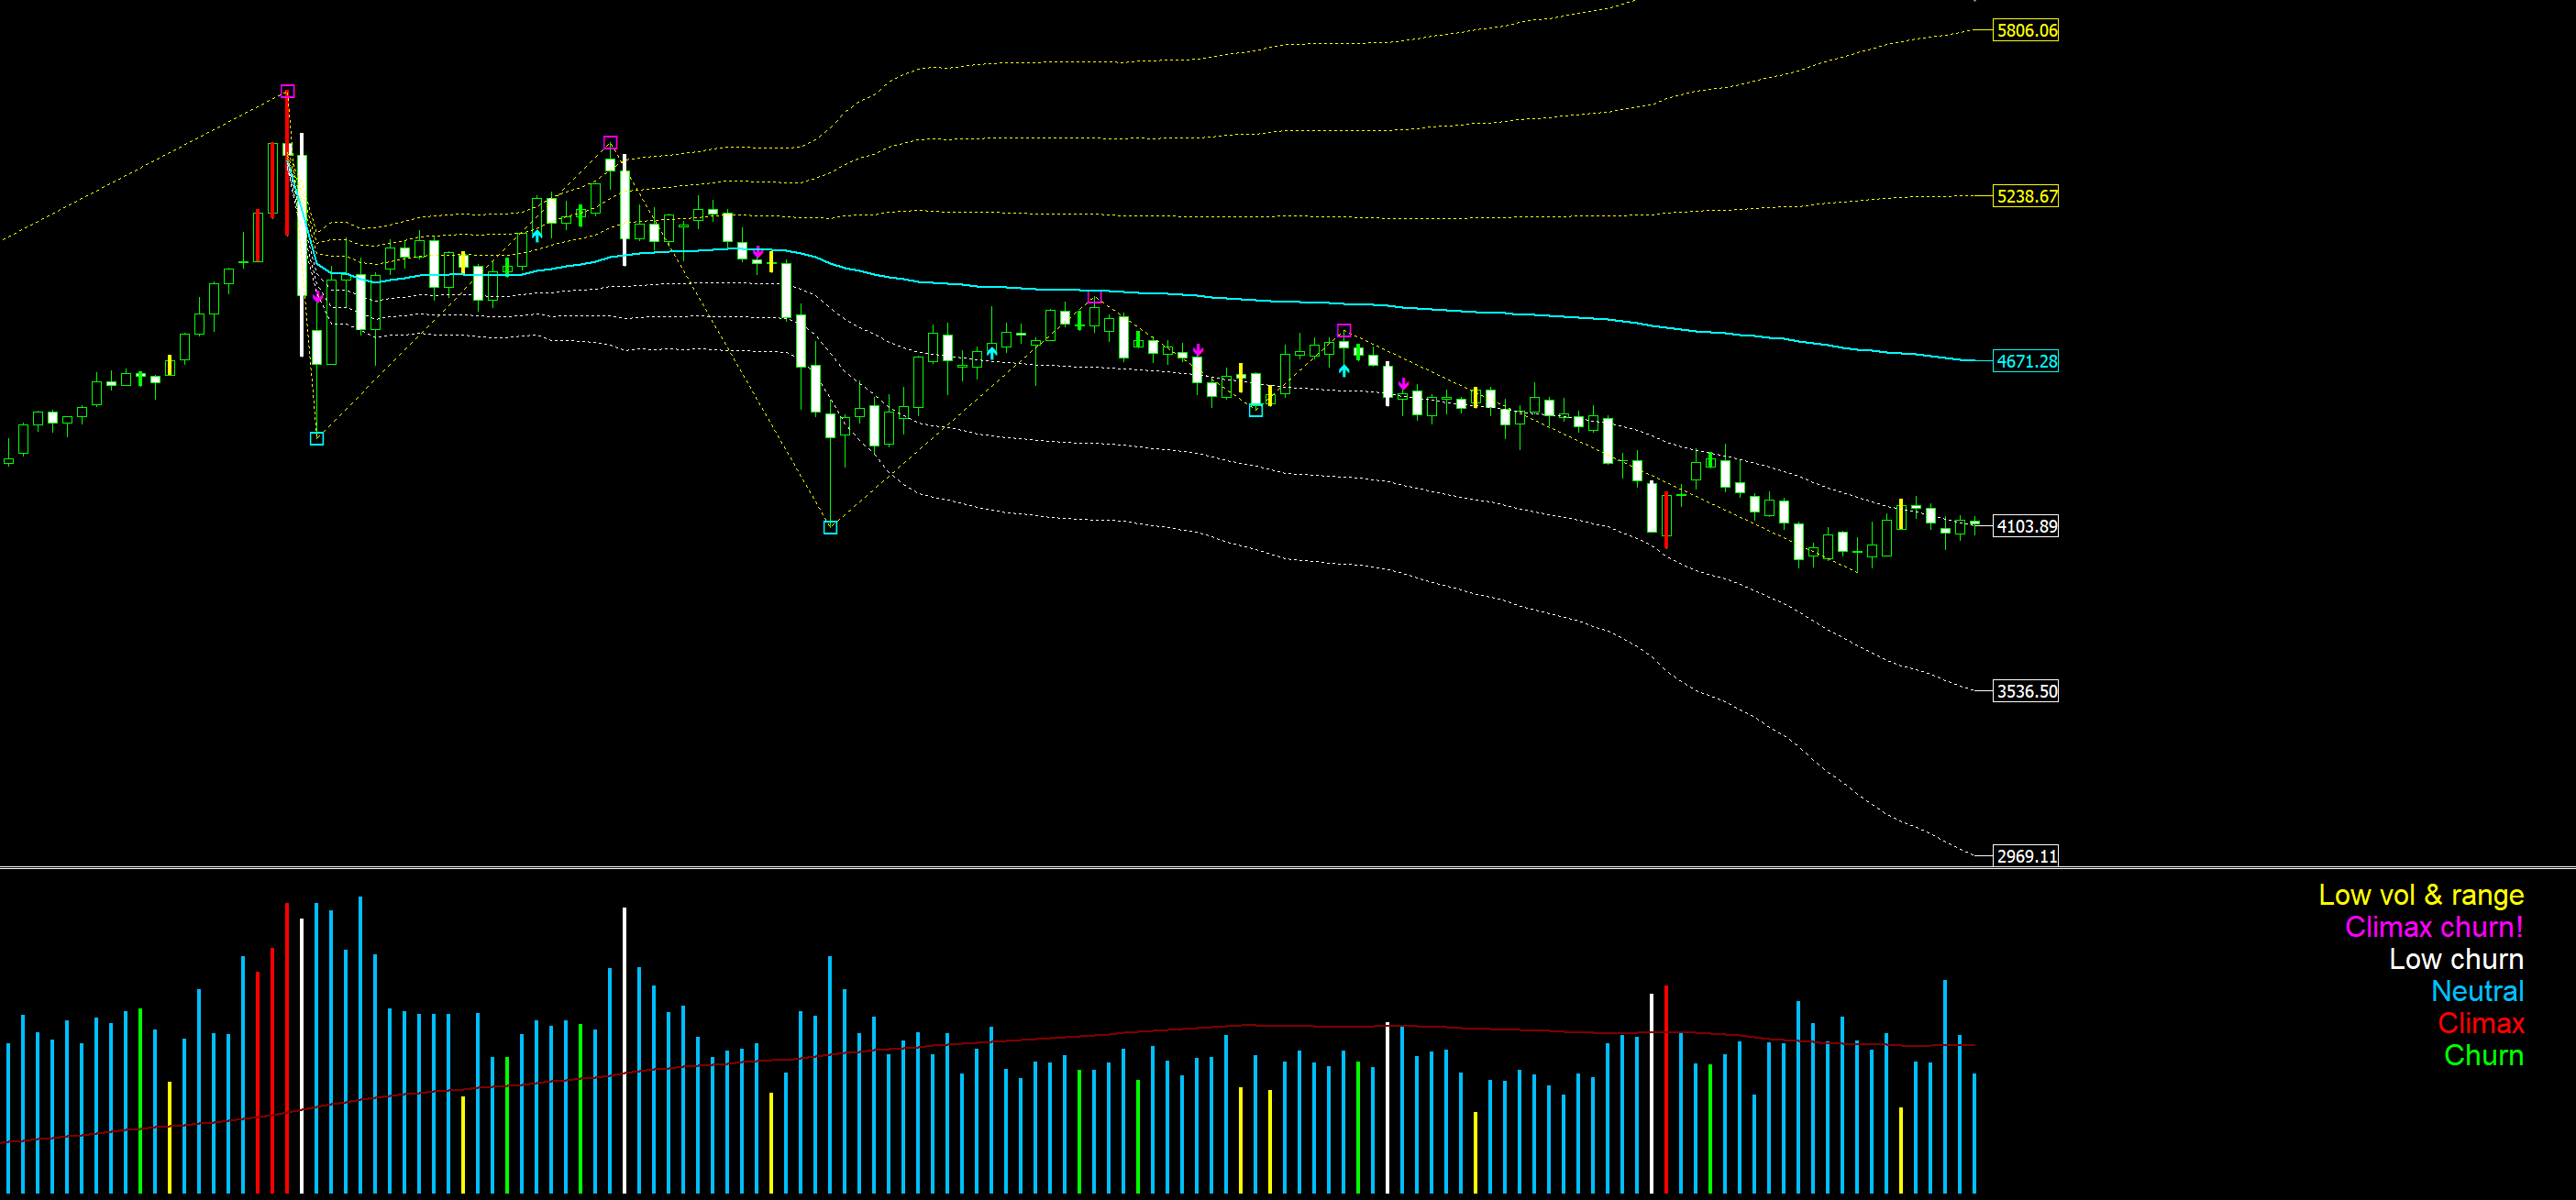
I agree 100%. My NRP ZigZag indicator draws an arrow at the current bar when the leg is drawn, in addition to a square in history at the actual extreme. The AVWAP will only re-anchor to the historic NRP ZigZag squares. Therefore, a cooldown period may already exist in this plan. That is what I meant by "The indicator's lag would be ok..." in Post #3. My AVWAP indicator merely has a single input time for manually setting the anchor time─making the two indicators programmatically plugando-and-play. Only testing can confirm, of course.
The only piece of the puzzle that I'm still debating is the "square bar" analysis, e.g., raw volume, positive deviation from average volume, VSA, spike bar, and/or pin bar evaluation.
Like so...
I agree 100%. My NRP ZigZag indicator draws an arrow at the current bar when the leg is drawn, in addition to a square in history at the actual extreme. The AVWAP will only re-anchor to the historic NRP ZigZag squares. Therefore, a cooldown period may already exist in this plan. That is what I meant by "The indicator's lag would be ok..." in Post #3. My AVWAP indicator merely has a single input time for manually setting the anchor time─making the two indicators programmatically plugando-and-play. Only testing can confirm, of course.
The only piece of the puzzle that I'm still debating is the "square bar" analysis, e.g., raw volume, positive deviation from average volume, VSA, spike bar, and/or pin bar evaluation.
that chart layout is extremely clean ryan, filtering those structural squares with vsa climax churn is definitely the way to go here, raw volume alone will give you false positives during thin session news spikes, but looking for massive institutional absorption at the extreme keeps your baseline solid, you can easily plugar a secondary volatility filter to cross-check the volume deviation, this ensures you only catch real institutional blocks and travar your avwap right at the heart of the true turnaround
It appears very faintly in the screenshot, but there is a 100 period MA applied to the sub-window volume indicator.

- Free trading apps
- Over 8,000 signals for copying
- Economic news for exploring financial markets
You agree to website policy and terms of use
Check out the new article: Building an Object-Oriented Session VWAP Engine in MQL5.
This article shows how to implement a session vwap in MQL5 as a reusable include class with a strict daily reset at broker midnight. The engine computes VWAP and volume‑weighted deviation bands only on closed bars and anchors accumulation with MqlDateTime to avoid distortions from missing candles. A companion indicator plots the baseline and bands, while an Expert Advisor reads signals once per bar for consistent, CPU‑efficient execution and reliable testing.
When I build intraday trading systems in MQL5, my first reflex is usually to drop a standard moving average on the chart to filter the short-term trend. This approach looks tolerable during dead market hours or tight ranges. However, live tests on liquid currency pairs reveal a major structural flaw. A major macro news candle can instantly shift the market baseline due to institutional volume. A simple moving average treats that heavy candle the same as a low-volume candle from the quiet night session because it only accounts for closing prices. This creates a dangerous trap for an automated robot. The Expert Advisor executes a trade at the moving average line, thinking it is a fair value pullback, but the real institutional volume anchor is left far behind.
The root of the error is that standard indicators entirely ignore tick volume arrays during their calculation passes. I wanted to replace this traditional approach with something much more adaptive that tracks where money is actually being spent. The Volume Weighted Average Price (VWAP) fulfills this role by weighting every price fluctuation by the absolute liquidity traded at that level. Standard MQL5 does not provide a native VWAP that resets daily and includes rolling deviation bands. This makes quick integration into automated strategies difficult. We will move the cumulative calculations into an include file. Then we will plot the baseline and volatility bands in a custom indicator for visual verification. Finally, we will integrate the module into an Expert Advisor for pullback trading.
Author: Amanda Vitoria De Paula Pereira