Discussing the article: "Pair Trading: Algorithmic Trading with Auto Optimization Based on Z-Score Differences"
The article "Pair Trading: Algorithmic Trading Based on Automatic Z-Score Difference Optimization" has been published.
Author: Yevgeniy Koshtenko
[T]he strategy in this article works best with Renko type chart
Renko charts are timeless, if you will. Even though each Renko brick still has a timestamp, the time scale of a custom Renko chart is not evenly incremented. Therefore, using Renko can potentially take the guesswork of manually selecting the best timeframe out of the trading process. Instead, you would be left to select the best brick size. Also, Renko inherently smooths out chart noise─every brick is the same size.
[W]hat are those above images about? What are you trying to tell us?
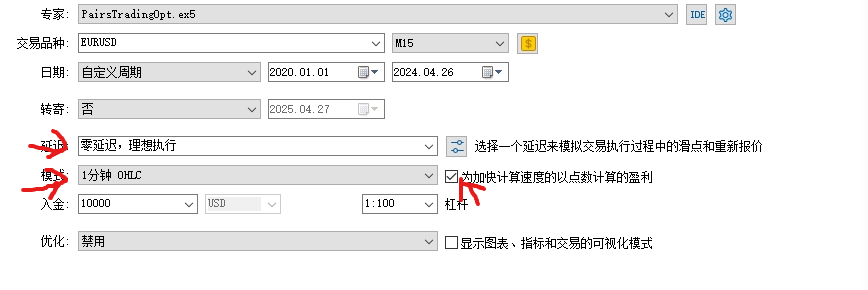
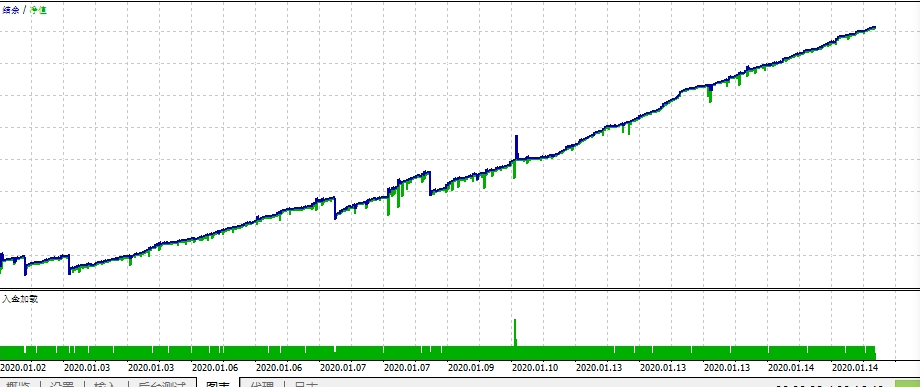
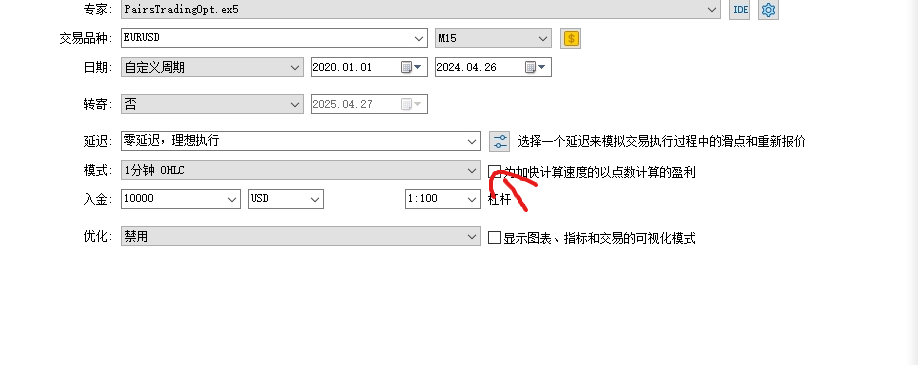
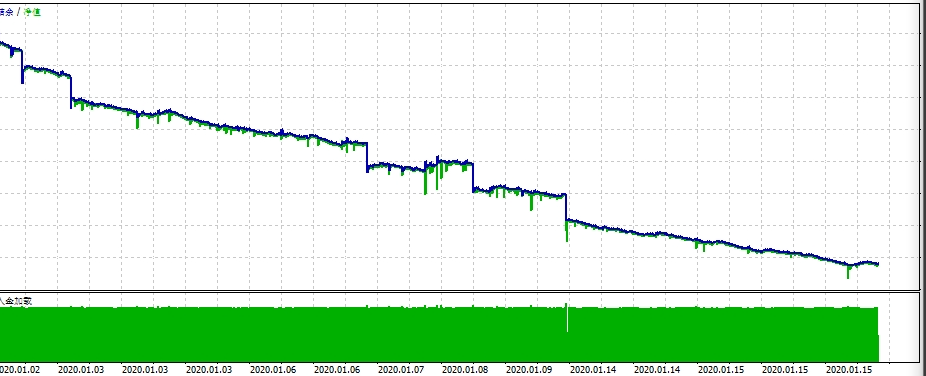
Although I can't read Chinese, I can read a pictograph. It appears that enabling "profit in pips for faster calculation" for this code is profitable in the Tester, while disabling it is unprofitable in the Tester.
Hello, Its an interesting strategy, I tried it on indices. 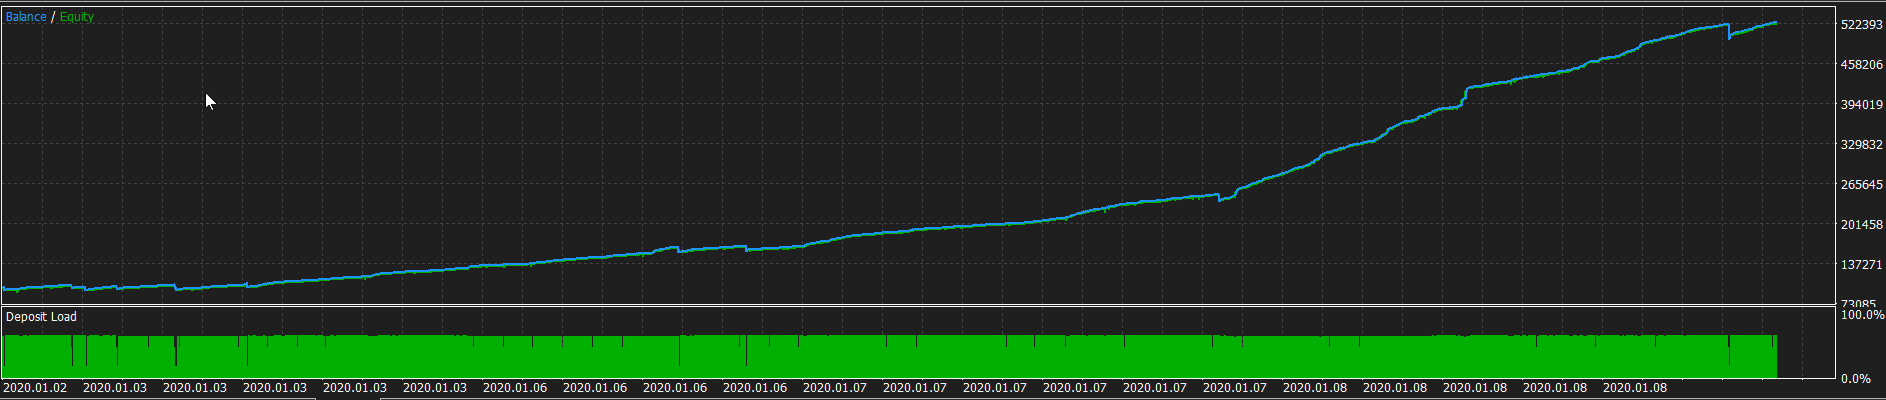
How to reduce the number of trades? Its taking too many until the Z score is below or above 2.
- Free trading apps
- Over 8,000 signals for copying
- Economic news for exploring financial markets
You agree to website policy and terms of use
Check out the new article: Pair Trading: Algorithmic Trading with Auto Optimization Based on Z-Score Differences.
The strategy is based on two important statistical concepts: correlation and stationarity. Correlation is a measure of the statistical relationship between two variables, indicating how closely a change in one variable is related to a change in the other. In the context of financial markets, the correlation between two assets can range from -1 (perfect negative correlation) to +1 (perfect positive correlation).
Stationarity is a property of a time series, in which its statistical characteristics, such as mean, variance, and autocorrelation, remain constant over time. For pair trading, it is important that the price relationship between two assets is stationary. In other words, it tends to return to the mean.
Author: Yevgeniy Koshtenko