Indicators: ATR ratio
newdigital, 2013.10.23 18:52
An Easy and Advanced Way to Set Stops
Talking Points:
- Stops are a necessity because no trading strategy wins 100% of the time
- Traders can use ATR to calculate stop distances based on recent price activity
- Price Action can be used to set stops in trending, or ranging market environments
But in the field of trading, risk management isn’t just a preference; it’s a necessity.
And the reason for this is simple: Because you cannot tell the future. And this means that no matter how hard you try, or how great a trader you become, you will simply never be able to avoid losing entirely. And as a natural extension of that fact, since you will lose on some trades, having sloppy risk management means that one or two losers can wipe away the gains of many small winners.
I know this may sound too simplistic; but this is exactly what was found to be The Number One Mistake that Forex Traders Make: They often win more frequently than they lose - but they lose so much when they are wrong that it wipes away all of the gains from their winners and then some.
Average losses (in red) far outpace average wins (in blue) :
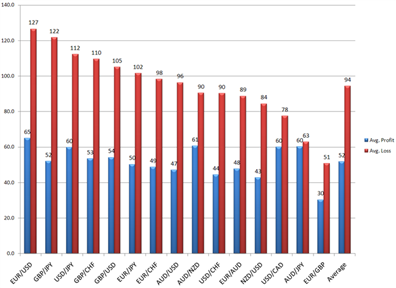
The first step to avoiding The Number One Mistake Forex Traders Make is to set a stop. This allows you to cap the risk on any one trade, so that if it doesn’t go in your direction, you can stem the bleeding before it becomes too unbearable.
Below, we’re going to look at two popular, yet different ways of setting stops. One easy way that is often employed by professional traders for the sake of simplicity; and another more advanced method that may suit certain trading styles more adequately.
The Easy Way
First off, just because this is an easier way of setting a stop does not make it any less valid. This is classified as ‘the easy way’ simply because most traders can pick this up right now, and begin using it instantly with a minimum of instruction.
Average True Range is a favorite indicator of many professional traders, and one of the great things about it is that it’s rather simple in its design. While many indicators wear multiple hats and try to do a few different things at once, ATR is just a measure of price movements over a specific period of time.
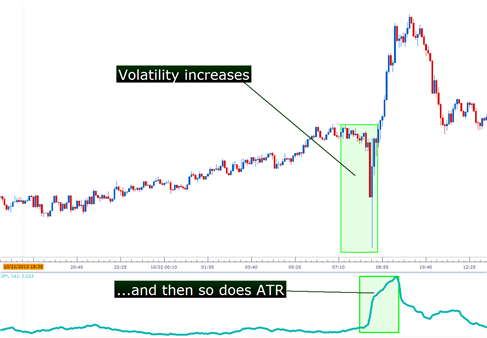
If those movements increase in value, ATR goes up. If those movements decrease, ATR goes down (see below).
ATR measures volatility, and this allows traders to set stops based actual market behavior :
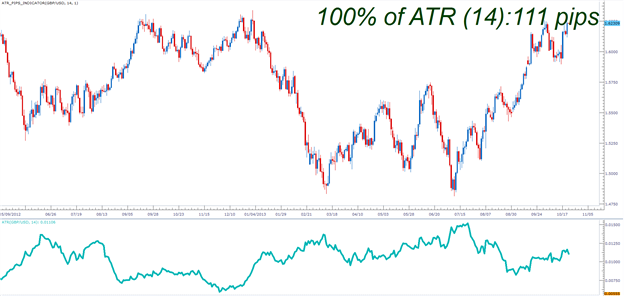
There are a few nuances of ATR that traders need to know before applying. We cover these, in depth in the article Managing Risk with ATR. The first is the format with which the indicator displays values. While it looks like an oscillator like RSI, and moves similar to an indicator like ADX; the real value of ATR is in its value. It will measure the ‘Average True Range’ of the last x periods, where x is the input you choose. The default, and most common input for ATR is 14 periods. The value of ATR will read in the price format of the currency pair being analyzed. So, for instance; if a value of .00760 is shown on EURUSD, that means 76 pips (4th place to the right of the decimal is a single pip in the quote).
ATR displays values in the format of the currency pair’s price :

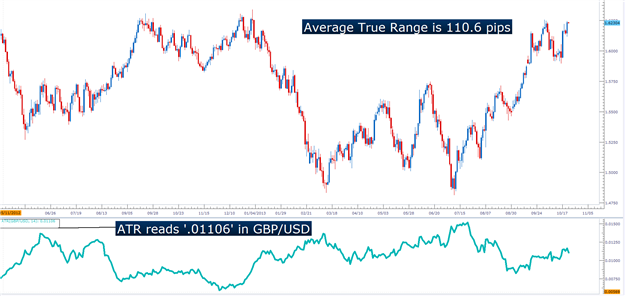
There is a slightly easier option, and for traders that are using short-term techniques this can be extremely helpful. There is a custom indicator available for Trading Station desktop that automatically calculates, and displays ATR on the chart in a very easy-to-read format. This is completely free, and can be downloaded from the FXCM App Store at this link (link). As you can see below, not only does it display ATR, but it even rounds the ‘.6’ fractional pip as appropriate.
The ‘ATR_Pips’ Indicator displays Average True Range in an easy-to-read format :
The Advanced Way
Price Action can have a huge impact on a trader’s performance. Inclusion of price action into an approach will often take place regardless of the trader or type of trading being done. Price action can help traders read trends, find support and resistance, and perhaps most importantly - manage risks.
Because, after all - if prices are trending higher, and we’re seeing continuous higher-highs, and higher-lows, wouldn’t it be reasonable to consider closing the trade if the trend reversed?
Remember, this is the number one mistake traders make, and this is the reason stops are so important. If the trend reverses, the trader’s best advice is often to close the trade and look for greener pasture elsewhere... because if the reversal continues against the trader, one loss can wipe away a lot of gains.
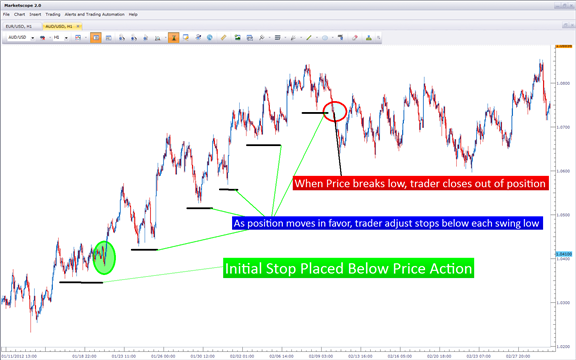
If traders are trading a trend, they can look to the previous opposing-side swing for stop placement. So, if an up-trend is being traded, we should be able to see higher-highs, and higher-lows. If we are buying to take part in the up-trend, we can look to place our stop below the prior swing-low (see picture).
During an up-trend, stops can be placed below the previous swing-low :
On the other hand, if we’re selling in a down-trend, we would want to look to place our stop above the prior swing-high.
During down-trend, stops can be placed above the previous swing-high
In How to Analyze and Trade Ranges with Price Action, we look at stop placement in
range-bound markets. If a range is being traded, the ‘peak-high’ and ‘peak-low’ should be identified (see below).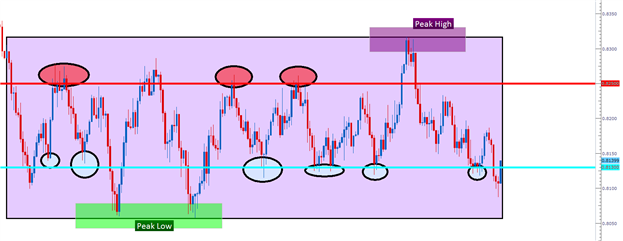
Traders can look to place their stop just outside of the peak of the opposing side of their position. So, if buying, traders would look to place their stop just below the peak-low; and if selling just above the peak-high. This way, if the range turns into a breakout against the trader, the bleeding can be stopped before one loser wipes away the gains from a lot of winners.
If you’d like to become a better Price Action trader, we’ve put together the basics into a Brainshark curriculum. The link below will take you directly to the lesson, and after filling in a few pieces of information into the guestbook the session will begin.
Great. :)
Thanks!
- Free trading apps
- Over 8,000 signals for copying
- Economic news for exploring financial markets
You agree to website policy and terms of use
ATR ratio:
The indicator of the ratio between fast Average True Range (ATR) and slow ATR.
ATR ratio often reach high values after the prices quick and strong movements. Low indicator values often correspond with long periods of flat that can be observed on the market top and during consolidation. It can be intepreted according to same rules as other volatility indicators.
Forecasting method using ATR ratio is as follows: the higher is the indicator value, the higher is the probability of a trend change; the lower is the value, the weaker is the trend movement. In case the indicator value climbs above the blue horizontal line, it is time to buy or sell.
High ATR ratio price levels often correlate with high volatility. Low ATR ratio price correlates with low volatility, as the prices stabilize or move along the channel flat movement up to the possible breakout point.
Author: Nikolay Kositsin