Discussing the article: "Elevate Your Trading With Smart Money Concepts (SMC): OB, BOS, and FVG" - page 2
You are missing trading opportunities:
- Free trading apps
- Over 8,000 signals for copying
- Economic news for exploring financial markets
Registration
Log in
You agree to website policy and terms of use
If you do not have an account, please register
You are mistaken, it's the same thing, I depicted the FVG with the price/candlesticks already retraced inside the FVG zone.
You're wrong or prepared your graphic poorly. As the 1-st and 3-rd candles (from the left) are shown in red, they are bearish and form 2 large gaps before and after the 2-nd candle (where presumably FVG occurred).
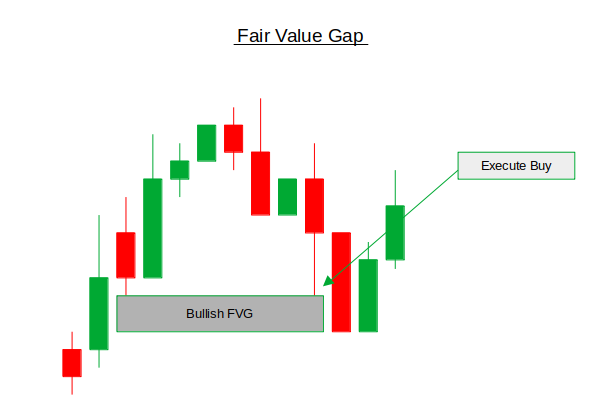
If you search through Internet for FVG, you'll find that this formation is about large unidirectional jump/gap in the price, not a zig-zag of jumps, which would obscure the whole effect for possible future retracements, because you don't know which one (of the 3 gaps) is about to close first (in your picture it's the last gap along the 3-rd candle, not the 2-nd one - it's closed by the 4-th candle).