Moving Average vs iMAOnArray
why are you trying to "reinvent the wheel"? There are many indicators on codebase that you could modify to suite your needs; using ima array and separate chart.
When using iMAOnArray, make sure the array is either fully processed in reverse using ArraySetAsSeries(true) with a loop from Bars minus one to zero, or keep it in default order with ArraySetAsSeries(false) and adjust the shift index accordingly.
Right now you're mixing both, which causes the discrepancy you're seeing.
Understanding functions like iMAOnArray and how buffers behave is part of the learning curve, and sometimes that means digging deeper rather than just reusing code.
You're almost there. The issue is likely due to a mismatch between the array order and how you're feeding data into it.
When using iMAOnArray, make sure the array is either fully processed in reverse using ArraySetAsSeries(true) with a loop from Bars minus one to zero, or keep it in default order with ArraySetAsSeries(false) and adjust the shift index accordingly.
Right now you're mixing both, which causes the discrepancy you're seeing.
I'm not quite sure what you mean.
You can see from my code that the val2 array is filled as per normal timeseries from right to left (newest to oldest). Because iMAOnArray works from left to right I switch the val2 array using ArraySetAsSeries.
I thought this would have worked?
I tried this and it still didn't give correct readings.
 for(i=Bars-1;i>=0;i--)
   {
    val1[i]=(Volume[i]+(Close[i]-Open[i])/Point/dXecn)/2;
    val2[i]=(Volume[i]-val1[i]);
   }

  if(nbar != iBars(NULL,0))
  {
   ArraySetAsSeries(val2,True);
   Print("val2 = ",iMAOnArray(val2,0,8,0,MODE_SMA,3));
   nbar = iBars(NULL,0);
  }
sorry i was busy at the time.
This is for mt5, however i believe most of the code will be appropriate for your needs.
sorry i was busy at the time.
This is for mt5, however i believe most of the code will be appropriate for your needs.
OK thanks. Not sure why you think I am trying to re-invent the wheel I'm just using an available MT4 function to get values from a dropped on MA.
This MT5 code compiles in MT4 and gives the same result as iMAOnArray().
The moving average I have applied to the data is the built-in drop on MA within MT4 using 'Previous indicator data'. Clearly this is modelling the data differently to the iMAOnArray function.
There are other posts that query the functionality of iMAOnArray() and suggest calling the movingaverages.mgh file to get the values of the MA.
So the question is: is iMAOnArray modelling the data correctly or is the built-in MA modelling it correctly?
Previously I have added the MA to the chart using the iMAOnArray() function and it does show a different MA to the standard MT4 one. So again which one is correct?
You're calculating val2 in normal order, but then using iMAOnArray with ArraySetAsSeries(val2, true), which reverses the interpretation of the array. That's why your printed SMA doesn't match the chart.
Fix: Move ArraySetAsSeries(val2, true); to the start of start(), before filling the array. That way, the data and the SMA will align properly.
Unfortunately this also does not work.
I quickly created another buffer to draw the iMAOnArray() MA from the val2 data. The result is below.

Two snapshots clearly showing the discrepancy.
Below is the source code (I think!) for iMAOnArray() and the built in MT4 moving average. I'm not a programmer but they don't look like they would calculate the same to me!!
double iMAOnArray(double& array[], int period, int ma_shift, ENUM_MA_METHOD ma_method, int shift)
{
   double buf[], arr[];
   int total = ArraySize(array);

   if(total <= period)
      return 0;

   if(shift > total - period - ma_shift)
      return 0;

   switch(ma_method)
   {
   case MODE_SMA: {
      total = ArrayCopy(arr, array, 0, shift + ma_shift, period);
      if (ArrayResize(buf, total) < 0)
         return 0;
      double sum = 0;
      int i, pos = total-1;

      for (i = 1; i < period; i++, pos--)
         sum += arr[pos];
      while (pos >= 0) {
         sum += arr[pos];
         buf[pos] = sum / period;
         sum -= arr[pos + period - 1];
         pos--;
      }
      return buf[0];
   }

   case MODE_EMA: {
      if (ArrayResize(buf, total) < 0)
         return 0;
      double pr = 2.0 / (period + 1);
      int pos = total - 2;

      while (pos >= 0) {
         if (pos == total - 2)
            buf[pos+1] = array[pos+1];
         buf[pos] = array[pos] * pr + buf[pos+1] * (1-pr);
         pos--;
      }
      return buf[shift+ma_shift];
   }
//+------------------------------------------------------------------+
//| Simple moving average on price array                             |
//+------------------------------------------------------------------+
int SimpleMAOnBuffer(const int rates_total,const int prev_calculated,const int begin,
                     const int period,const double& price[],double& buffer[])
  {
   int i,limit;
//--- check for data
   if(period<=1 || rates_total-begin<period) return(0);
//--- save as_series flags
   bool as_series_price=ArrayGetAsSeries(price);
   bool as_series_buffer=ArrayGetAsSeries(buffer);
   if(as_series_price)  ArraySetAsSeries(price,false);
   if(as_series_buffer) ArraySetAsSeries(buffer,false);
//--- first calculation or number of bars was changed
   if(prev_calculated==0) // first calculation
     {
      limit=period+begin;
      //--- set empty value for first bars
      for(i=0;i<limit-1;i++) buffer[i]=0.0;
      //--- calculate first visible value
      double firstValue=0;
      for(i=begin;i<limit;i++)
         firstValue+=price[i];
      firstValue/=period;
      buffer[limit-1]=firstValue;
     }
   else limit=prev_calculated-1;
//--- main loop
   for(i=limit;i<rates_total;i++)
      buffer[i]=buffer[i-1]+(price[i]-price[i-period])/period;
//--- restore as_series flags
   if(as_series_price)  ArraySetAsSeries(price,true);
   if(as_series_buffer) ArraySetAsSeries(buffer,true);
//---
    return(rates_total);
  }
- Free trading apps
- Over 8,000 signals for copying
- Economic news for exploring financial markets
You agree to website policy and terms of use
Hello guys,
I have a very simple indicator drawn in a subwindow, the code of which is below:
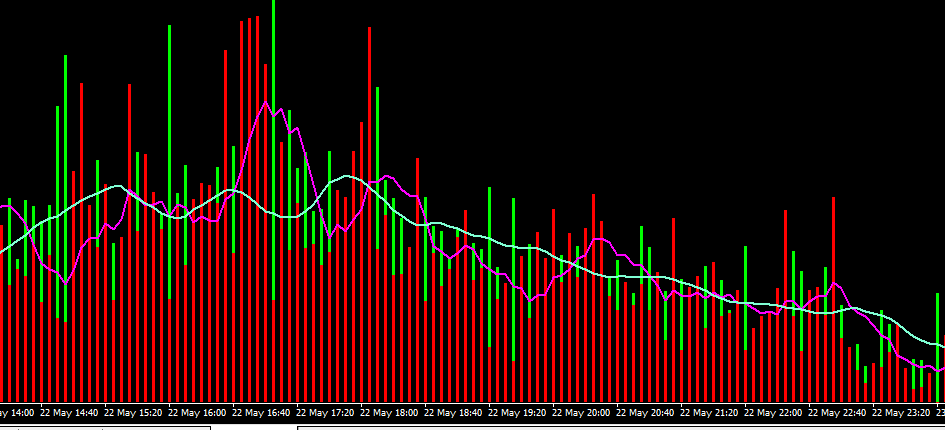
An example of the output is shown below with an 8SMA (applied price = previous indicators data) dropped into the subwindow.
(note: there is an 8SMA also attached with is not shown in colour that uses applied price = first indicator data.)
I now want to get the values of the moving average so I use the iMAOnArray function.
The results of the print statement do not match the values of the moving average shown in the data window - so for a bar shift of 5 for example:
print statement = 533.87 data window = 544.46
I have checked many more values but the two do not agree with each other. It also doesn't seem to make much difference if I set ArraySetAsSeries to either True or False.
Can anybody see any errors please or suggest why the two values do not match?
thank you.