for me is a bug for you ?
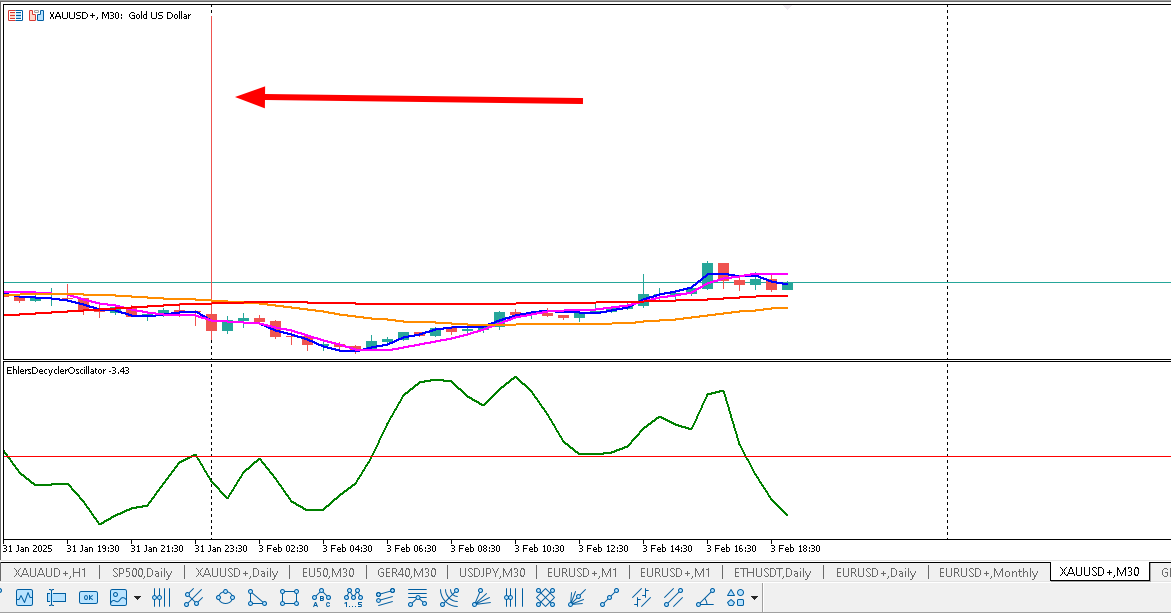
I noticed that when a mega spike appears on a chart, like at the beginning of this morning's session, the chart gets confined between the spike’s extreme high and low. Even if I zoom in, the chart remains compressed and hard to read. To get a decent view, I have to scroll back until the overnight spike is removed. Is there a way to avoid this issue, or could you implement a fix for it? 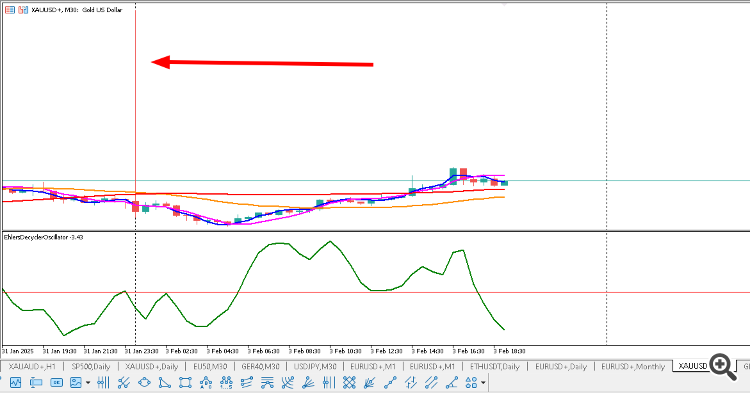
- [Archive!] Any rookie question, so as not to clutter up the forum. Professionals, don't pass it by. Couldn't go anywhere without you - 2.
- MT5 platform always keeps scrolling back on its own
- Make It No Repaint Please!
XAU/USD M30 timeframe ?
I checked two brokers - and I do not have such a spike.
-----------------------
The price is related to the brokers only so you should ask their support about it (because it is nothing to do with Metatrader for example).
faustf:
I noticed that when a mega spike appears on a chart, like at the beginning of this morning's session, the chart gets confined between the spike’s extreme high and low. Even if I zoom in, the chart remains compressed and hard to read. To get a decent view, I have to scroll back until the overnight spike is removed. Is there a way to avoid this issue, or could you implement a fix for it?
I noticed that when a mega spike appears on a chart, like at the beginning of this morning's session, the chart gets confined between the spike’s extreme high and low. Even if I zoom in, the chart remains compressed and hard to read. To get a decent view, I have to scroll back until the overnight spike is removed. Is there a way to avoid this issue, or could you implement a fix for it?
The "fix" that I use is:
- Scroll vertically out until all price bars are basically a flat line,
- Tap F8 on the keyboard,
- Click on the Common tab,
- Checkmark Scale fix, and
- Scroll vertically in until you reach the desired zoom.
The chart auto scale uses the highest and lowest prices into the displayed range, as it's expected.
If you don't want to see that values you should let it to be out of your range. Use lower or higher timeframe, or wait some time.
Otherwise you can set the manual scale to the chart and set your max and min value, but you will miss some informations if out of that range.
You are missing trading opportunities:
- Free trading apps
- Over 8,000 signals for copying
- Economic news for exploring financial markets
Registration
Log in
You agree to website policy and terms of use
If you do not have an account, please register