Hello Igor,
This EA does "BUYS" only.
Seems to be something wrong in the sell math equation? Maybe?
Thanks
Igor, kannst du einen RSI für überkauft und überverkauft hinzufügen, und zwar bei 70 bzw. 30, wenn die nächste Kerze eine bärische oder bullische Kerze wird?
Hello Jianhua,
I will do that. But how should the RSI indicator behave?
If below 30 then buy and above 70 sell?
Greetings Igor
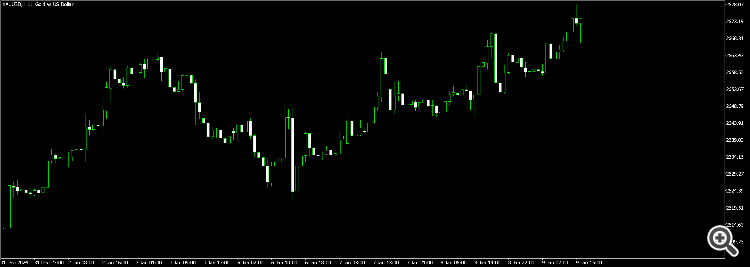
PS: In your case, the EA with RSI indicator will trade very rarely.Wow. On your chart, your CFD dealer's gold price dropped to 2020.00 on January 8, 2025.
On my chart, my Metaquotes' XAUUSD demo price stayed well above 2600.00. This price was virtually the same on my live gold futures data from the Chicago Mercantile Exchange.
Wow. In Ihrem Chart ist der Goldpreis Ihres CFD-Händlers am 8. Januar 2025 auf 2020,00 gefallen.
Auf meinem Chart blieb der XAUUSD-Demopreis von Metaquotes deutlich über 2600,00. Dieser Preis war in meinen Live-Gold-Futures-Daten der Chicago Mercantile Exchange praktisch derselbe.
Hello Ryan,
in my chart it is the year 2023.
Greetings Igor
😅 I suggest you reflect on your observation a bit!!!!
Given that the code was published on 2025.01.01 and then updated 2025.01.03, do you really think the chart, which has data for January 8th, is referring to the period 2024/2025?
If you look closely, on the left of the chart, there is an initial date of "26 Dec 2023", just as your chart has an initial date of "31 Dec 2024".
- Free trading apps
- Over 8,000 signals for copying
- Economic news for exploring financial markets
You agree to website policy and terms of use


BollingerBandsEA:
BollingerBandsEA trades according to Bollinger Bands.
Author: Igor Widiger