Indicators: PTB
It's a good indicator. The price bounces are very significant as long as one has patience to ignore a short fake bounce. I changed the colors to match my preference as I prefer a very minimalistic color scheme.
Paul #:
What settings are you using?
What settings are you using?
I change the default code layout for myself.
//--- plot shortHigh
#property indicator_label1  "shortHigh"
#property indicator_type1   DRAW_LINE
#property indicator_color1  clrNONE
#property indicator_style1  STYLE_SOLID
#property indicator_width1  1
//--- plot shortLow
#property indicator_label2  "shortLow"
#property indicator_type2   DRAW_LINE
#property indicator_color2  clrNONE
#property indicator_style2  STYLE_SOLID
#property indicator_width2  1
//--- plot longHigh
#property indicator_label3  "longHigh"
#property indicator_type3   DRAW_LINE
#property indicator_color3  clrGreen
#property indicator_style3  STYLE_SOLID
#property indicator_width3  3
//--- plot longLow
#property indicator_label4  "longLow"
#property indicator_type4   DRAW_LINE
#property indicator_color4  clrOrange
#property indicator_style4  STYLE_SOLID
#property indicator_width4  3
//--- plot fibo786
#property indicator_label5  "fibo786"
#property indicator_type5   DRAW_LINE
#property indicator_color5  clrGray
#property indicator_style5  STYLE_DOT
#property indicator_width5  1
//--- plot fibo236
#property indicator_label6  "fibo236"
#property indicator_type6   DRAW_LINE
#property indicator_color6  clrGray
#property indicator_style6  STYLE_DOT
#property indicator_width6  1
//--- plot fibo382
#property indicator_label7  "fibo382"
#property indicator_type7   DRAW_LINE
#property indicator_color7  clrGray
#property indicator_style7  STYLE_DOT
#property indicator_width7  1
//--- plot fibo618
#property indicator_label8  "fibo618"
#property indicator_type8   DRAW_LINE
#property indicator_color8  clrGray
#property indicator_style8  STYLE_DOT
#property indicator_width8  1
//--- plot fibo50
#property indicator_label9  "fibo50"
#property indicator_type9   DRAW_LINE
#property indicator_color9  clrGray
#property indicator_style9  STYLE_SOLID
#property indicator_width9  3

//--- input parameters
input int shortLength = 10;
input int longLength = 200;
You are missing trading opportunities:
- Free trading apps
- Over 8,000 signals for copying
- Economic news for exploring financial markets
Registration
Log in
You agree to website policy and terms of use
If you do not have an account, please register
PTB:
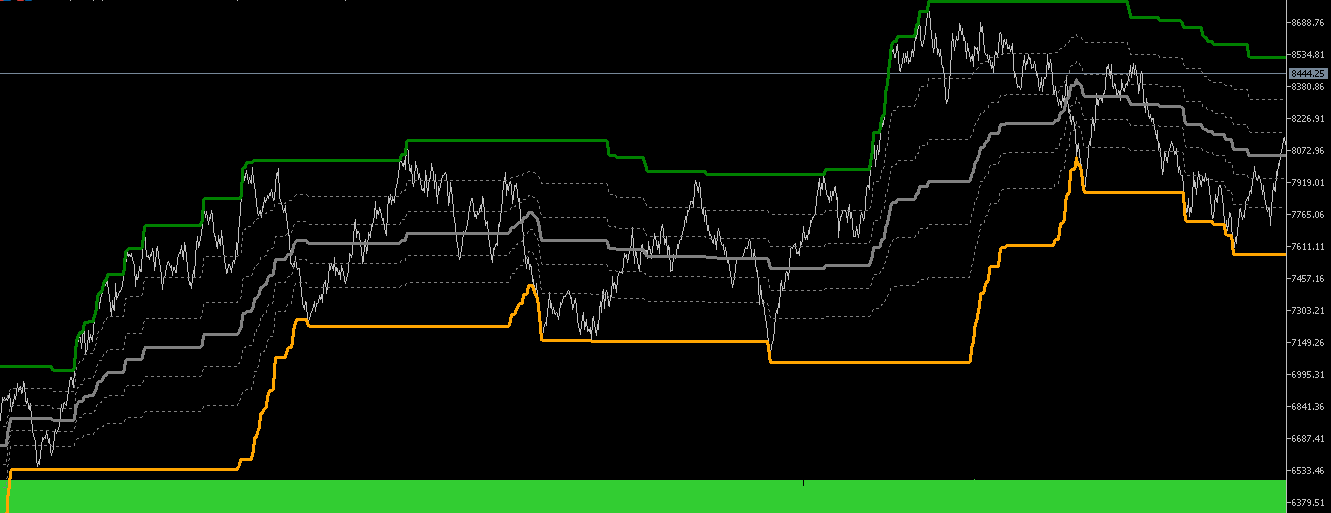
Indicator Description: PTB.mq5 Overview: The PTB.mq5 indicator for MetaTrader 5 calculates short-term and long-term high and low prices, along with Fibonacci retracement levels based on these extremes. Features: Short-Term High and Low: Identifies immediate support and resistance over a user-defined short length. Long-Term High and Low: Analyzes broader market trends over a longer period. Fibonacci Levels: Plots key retracement levels (23.6%, 38.2%, 50%, 61.8%, 78.6%) for potential reversal points. Input Parameters: shortLength: Number of candles for short-term calculation. longLength: Number of candles for long-term calculation. Visual Representation: Distinct colors and widths for each line to differentiate between high/low and Fibonacci levels. Usage: Helps traders identify entry/exit points and monitor market trends based on historical price levels.
Author: Phan Thanh Binh