Historical data
Hello, when downloading bar data for 1 minute of an asset and also the tick data for the same asset an unexplainable happens. Lets say close price at 12:00:00 is 100. Tick data shows that at 11:59:59 bid and ask were 101 and 102, and at 12:00:01 they were for example 102 and 103(these are all examples. Can you explain how can price close lower than bid and ask.
- Useful features from KimIV
- is this true?
- Problem with indicator. Please help me fix it.
Erik Shekunts:
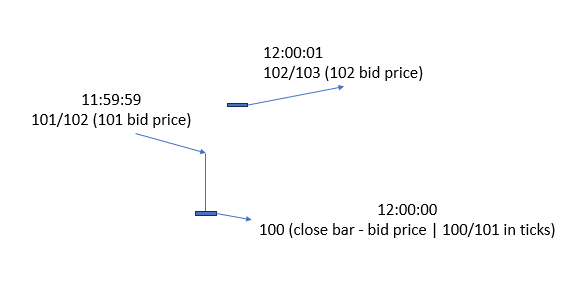
Hello, when downloading bar data for 1 minute of an asset and also the tick data for the same asset an unexplainable happens. Lets say close price at 12:00:00 is 100. Tick data shows that at 11:59:59 bid and ask were 101 and 102, and at 12:00:01 they were for example 102 and 103(these are all examples. Can you explain how can price close lower than bid and ask.
Hello, when downloading bar data for 1 minute of an asset and also the tick data for the same asset an unexplainable happens. Lets say close price at 12:00:00 is 100. Tick data shows that at 11:59:59 bid and ask were 101 and 102, and at 12:00:01 they were for example 102 and 103(these are all examples. Can you explain how can price close lower than bid and ask.
I see nothing strange in this. 1 point spread and 1 point of gap. The construction of the bars is the bid price.
The only questions I have is when I backtest only on close prices my strategy is breakeven, but with bid ask prices its profitable. I am using python with downloaded data not EA. What are yor thoughts on that
You are missing trading opportunities:
- Free trading apps
- Over 8,000 signals for copying
- Economic news for exploring financial markets
Registration
Log in
You agree to website policy and terms of use
If you do not have an account, please register