How to fix flickering bitmap when updating its size accordingly? - page 3
You are missing trading opportunities:
- Free trading apps
- Over 8,000 signals for copying
- Economic news for exploring financial markets
Registration
Log in
You agree to website policy and terms of use
If you do not have an account, please register
I couldn't run your code because of an error (array out of range in 'Ex.mq5' (143,31)). When I bypassed this error, nothing is displayed.
That's totally weird.
Somehow index 0 in the array doesn't contain the name of the object when performing ChartObjectName().
The first index 0 should have a name "144_97"
Clearly I added 2 objects into the array, somehow only the 2nd object that has name.
I couldn't run your code because of an error (array out of range in 'Ex.mq5' (143,31)). When I bypassed this error, nothing is displayed.
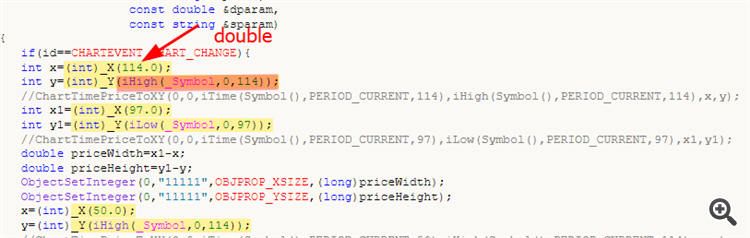
Yes, are the _X() and _Y() functions correct
Alain, I was not lazy and checked.
The check showed that the reason is ChartTimePriceToXY.
Your code is running with flickering due to frequent use of ChartTimePriceToXY. My code doesn't flicker.
No !
As your video shows perfectly there is NO flickering with the red rectangle which is the one I fixed.
I never said that ChartTimePriceToX() is not a costly operation, I said it was not the reason for the flickering in this case and you perfectly proved it.
P.S: Sorry for posting code that doesn't compile, it was late.
What does the red rectangle have to do with it when your blue one is flickering?
Yes, are the _X() and _Y() functions correct
No!
And why did you insert my library into your code?
What didn't you like about one line of code:
#include <Canvas\iCanvas_CB.mqh>instead of 900 lines of code?
But I must say that your logic and code are very far from perfect. I would never do that. Study, study and study again. I advise you to forget about operations with strings, if this is not done directly to generate a string for output (for Print or Comment)
What does the red rectangle have to do with it when your blue one is flickering?
You still don't understand !
The flickering is NOT due to ChartTimePriceToXY() but to bad coding, I fixed the bad coding for the red rectangle and it doesn't flicker.
Proof by code. Run the attached code and see...no flickering for both rectangles, but it's still using ChartTimePriceToXY.
You still don't understand !
The flickering is NOT due to ChartTimePriceToXY() but to bad coding, I fixed the bad coding for the red rectangle and it doesn't flicker.
Your code doesn't flicker at all because you coded it properly, not because you don't use ChartTimePriceToXY.
Proof by code. Run the attached code and see...no flickering for both rectangles, but it's still using ChartTimePriceToXY.
It doesn't matter that there are errors. Anyway, when you fix all the errors, you will run into incredible lags in your code due to the use of ..XY.. ChartGet.. functions.
I showed you that in your code the blue rectangle flickers, but in mine it doesn't. These are only two rectangles, and if there are 100 of them, the system will lag terribly.
Of course it matters. Anyway that's enough, if you want to be right, ok you are right.
I am more interested by this flickering, do you see it (it's a GIF, click on it) ? Do you know how to fix it ?
The reason for the flickering in your example is the use of the ChartTimePriceToXY function.
This is a very slow function (in MQL5). Why it's slow is a very long story. I consider this to be a semantic MQ bug, but I'm tired of fighting with MQ on this issue.
You can use my library iCanvas_CB.mqh, which does not use this function to convert coordinates (time, price) to pixel coordinates. In this library you can see how you can do without these (..XY.. ChartGet.. ChartSet..) very slow functions in order to implement these functions yourself and not use my library.
Alternatively, you can use one canvas stretched over the entire chart window and form all the objects in it (I attach an example TestCanvas2Rect.mq5), but in this case the redrawing will lag behind the chart when scrolling, since the canvas is not tied to time and price.
There is an issue with your code. It's not always precise and reliable ! The top left corner is supposed to be at the high of candle 50 right ? But it is not, there is a small shift almost always present :
And sometimes a big shift :
There is an issue with your code. It's not always precise and reliable ! The top left corner is supposed to be at the high of candle 50 right ? But it is not, there is a small shift almost always present :
And sometimes a big shift :
And also issue on the X axis :
Same rectangle, I just moved the chart horizontally.