Your topic has been moved to the section: MQL4 e MetaTrader 4 — In the future, please consider which section is most appropriate for your query.
No! Such time-frames are not standard on MT4.
One would have to create Offline Chart (with the aid of a custom MQL4 program), but they would not be tradeable—only for viewing.
Lets say I want to pull up a 20min chart? Or a 90min chart Im assuming there are indicators that all for this?
Thanks
To display a price chart for a currency pair, let's assume we choose the NZDUSD chart. To create an 8-hour timeframe, we can use the 4-hour timeframe as the primary and reference chart.
Once the 4-hour timeframe chart is displayed, you need to open the Navigator window (shortcut keys: Ctrl + N).
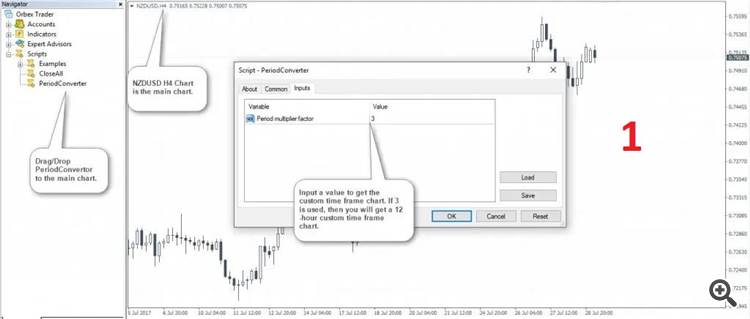
Now, open the "Scripts" tab and click on "PeriodConverter." This script converts the base timeframe to your desired timeframe. Since we want to create an 8-hour chart, drag and drop the PeriodConverter script onto the primary chart (i.e., the 4-hour NZDUSD chart).
At this stage, a window will appear asking you to enter a value. By default, the number 3 is selected. Change this number to 2 (2 * 4 = 8).
Alternatively, you can use a 1-hour chart as the reference timeframe and enter the number 8 in this section. In this case, 1 hour * 8 creates an 8-hour chart.
In image number one, you can see instructions for creating an 8-hour NZDUSD chart based on a 4-hour time frame
As soon as you enter the desired number in this section, the window disappears.
To open the chart in the created timeframe, you can click on "Open Custom Time Frame" in the menu bar, under the "File" section. In the opened window, find the desired currency pair and the created timeframe.
In this example, the image below shows the NZDUSD currency pair in the H8 timeframe. Select this chart and click on "Open".

I hope this example is useful for you.
To display a price chart for a currency pair, let's assume we choose the NZDUSD chart. To create an 8-hour timeframe, we can use the 4-hour timeframe as the primary and reference chart.
Once the 4-hour timeframe chart is displayed, you need to open the Navigator window (shortcut keys: Ctrl + N).
Now, open the "Scripts" tab and click on "PeriodConverter." This script converts the base timeframe to your desired timeframe. Since we want to create an 8-hour chart, drag and drop the PeriodConverter script onto the primary chart (i.e., the 4-hour NZDUSD chart).
At this stage, a window will appear asking you to enter a value. By default, the number 3 is selected. Change this number to 2 (2 * 4 = 8).
Alternatively, you can use a 1-hour chart as the reference timeframe and enter the number 8 in this section. In this case, 1 hour * 8 creates an 8-hour chart.
In image number one, you can see instructions for creating an 8-hour NZDUSD chart based on a 4-hour time frame
As soon as you enter the desired number in this section, the window disappears.
To open the chart in the created timeframe, you can click on "Open Custom Time Frame" in the menu bar, under the "File" section. In the opened window, find the desired currency pair and the created timeframe.
In this example, the image below shows the NZDUSD currency pair in the H8 timeframe. Select this chart and click on "Open".
I hope this example is useful for you.
Thanks for the information appreciate it.
- Free trading apps
- Over 8,000 signals for copying
- Economic news for exploring financial markets
You agree to website policy and terms of use

Lets say I want to pull up a 20min chart? Or a 90min chart Im assuming there are indicators that all for this?
Thanks