Is this possible?
Chioma Obunadike:
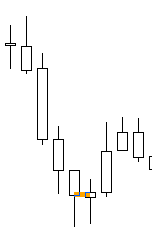
I'm trying to code an indicator that can change the colour of a particular candlestick (e/g candle stick at position 0 = current candle) ONLY.
I tried using the chartsetinterger function but it changed the color of all the candlesticks in the charts (There is no option to specify the exact candle you want to change the colour or maybe I am missing something)
I looked here in the forum for more ideas and I found on where I can use a rectangle over the candle. Okay? That didn't turn out so well. Since I used time for the rectangle co-ordinates as time[0] and time[1] respectively.
Here, I'll show you the codes. If you can help, Please do. Thank you
ObjectCreate(ChartID(), name, OBJ_RECTANGLE, 0, time1 - (PeriodSeconds()/2),price1,time1 + (PeriodSeconds()/2),price2);
Okay got it. Perfect. It works now. Thank you so much
You are missing trading opportunities:
- Free trading apps
- Over 8,000 signals for copying
- Economic news for exploring financial markets
Registration
Log in
You agree to website policy and terms of use
If you do not have an account, please register
I'm trying to code an indicator that can change the colour of a particular candlestick (e/g candle stick at position 0 = current candle) ONLY.
I tried using the chartsetinterger function but it changed the color of all the candlesticks in the charts (There is no option to specify the exact candle you want to change the colour or maybe I am missing something)
I looked here in the forum for more ideas and I found on where I can use a rectangle over the candle. Okay? That didn't turn out so well. Since I used time for the rectangle co-ordinates as time[0] and time[1] respectively.
Here, I'll show you the codes. If you can help, Please do. Thank you