I want to see more data for a signal I am subscribed to
- HELP - Random positions opening up
- My signal and subscribers
- Is there a way to go back for some time and see how the price changing?
Frequently Asked Questions about the Signals service

- 2013.02.20
- www.mql5.com
Hello, I like how you can check the growth data month by month on the account stats on a signal. However I would like to be able to do the same with drawdown for example. The drawdown chart is limited and only shows few days worth of data. Is there a way to go further back?
These statistics are limited because the signal has been published only recently.
An account cannot be monitored if it is not connected to a database, so you can't find details about the previous period.
These statistics are limited because the signal has been published only recently.
An account cannot be monitored if it is not connected to a database, so you can't find details about the previous period.
I am confused... the signal was running since last year, yet the drawdown tab only shows DD for the last 2 weeks.
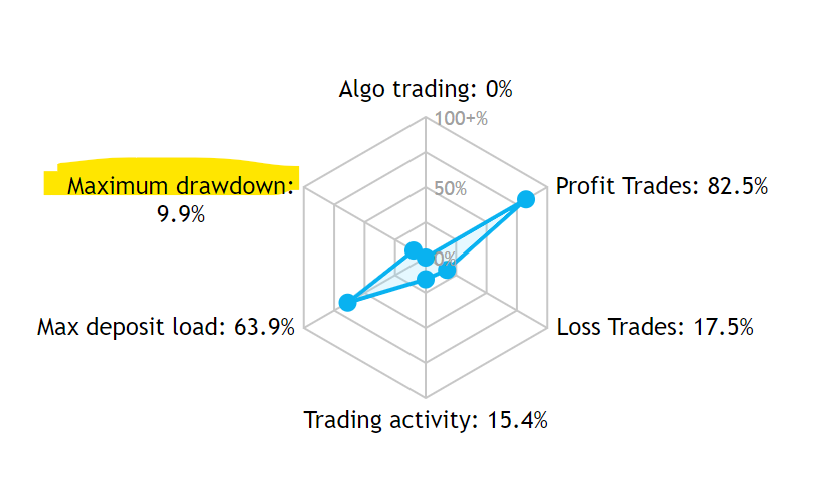
Also at the very top (highlighted in picture) is that the highest DD since the signal started or is it relative to the limited data in the graph below?
I am confused... the signal was running since last year, yet the drawdown tab only shows DD for the last 2 weeks.
Also at the very top (highlighted in picture) is that the highest DD since the signal started or is it relative to the limited data in the graph below?
As I said before, the signal may run since last year, but it was connected to MQL5.com just 2 weeks agon, from what you say.
The maximum drawdown stats and graph, are only valid since the signal was connected to MQL5.com signal database.
An account cannot be monitored if it is not connected to a database, so you can't find details about the previous period.
Below you see a similar exmple.
Oh, that's horrible. I didn't realise I wouldn't get complete data. Well, now I understand how the DD jumped to 10% on my first day using the signal. It makes really hard to trust any signals if the data can be partial like that.
Oh, that's horrible. I didn't realise I wouldn't get complete data. Well, now I understand how the DD jumped to 10% on my first day using the signal. It makes really hard to trust any signals if the data can be partial like that.
That's why is crucial to check the date a signal has been published in MQL5.com.
A lot of signals are being connected from the very beginning, so their stats are trustworthy.
- Free trading apps
- Over 8,000 signals for copying
- Economic news for exploring financial markets
You agree to website policy and terms of use