why do I get the high under close, open and low????
Please don't post randomly in any section. Your topic has been moved to the section: Expert Advisors and Automated Trading
sorry ... I thought this was a general question.
Then no one can help you. You will have to fix your own code. If you are not able to debug your own code, then I don't think you should be writing an article at this point.
I doubt, that there is any problem with the data, as I use the same broker and symbol myself. Something else is wrong, and 99% percent of the time, it is one's own code.
EDIT2: By the way, in English, it is "Prices" ("Precios"), not "*Prizes" ("Premios")
Also, tick data does not have OHLC prices. Only bar data has OHLC prices. Tick data can only have Ask, Bid (and Last prices for some symbols, like futures).
I doubt, that there is any problem with the data, as I use the same broker and symbol myself. Something else is wrong, and 99% percent of the time, it is one's own code.
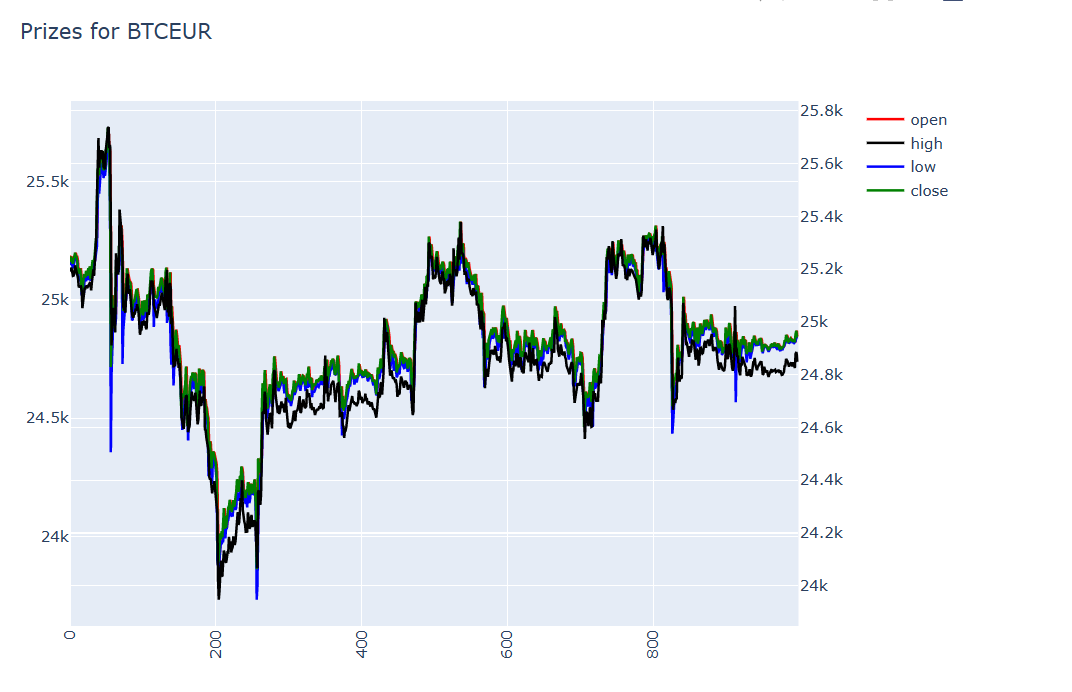
def ML(symbol):

            data3=[]
            data3 =pd.DataFrame( mt5.copy_rates_from_pos(symbol, mt5.TIMEFRAME_M15, 0, tpd))
            data_raw=data3
                ....
            return variacion, diferencia_en_porcentaje, diferencia, data3, data_raw

....
variacion, diferencia_en_porcentaje, diferencia, data3, data_raw = ML(symbol)

....
data=data_raw


import plotly.graph_objects as go
                from plotly.subplots import make_subplots

                df = data
                longitud=np.arange(len(df))
                trace1 = go.Scatter(
                    x =longitud,
                    y = df['open'],
                    name='open',
                    marker=dict(
                        color='red'
                        )
                )

                trace2 = go.Scatter(
                    x =longitud,
                    y = df['high'],
                    name='high',
                    marker=dict(
                        color='black'
                        )
                )

                trace3 = go.Scatter(
                    x = longitud,
                    y = df['low'],
                    name='low',
                    marker=dict(
                        color='blue'
                        )
                )

                trace4 = go.Scatter(
                    x = longitud,
                    y = df['close'],
                    name='close',
                    marker=dict(
                        color='green'
                        )
                )

                fig = make_subplots(specs=[[{"secondary_y": True}]])
                fig.add_trace(trace1)
                fig.add_trace(trace2,secondary_y=True)
                fig.add_trace(trace3)
                fig.add_trace(trace4)
                fig['layout'].update(height = 600, width = 800, title = symbol,xaxis=dict(
                    tickangle=-90
                    ))


                fig.update_layout(
                    title = 'Prizes for '+str(symbol),
                    xaxis_tickformat = '%d %B (%a)<br>%Y'
                )

                fig.show()
well ... don't know why the high is not showing propperly
eaven more straight foreguard
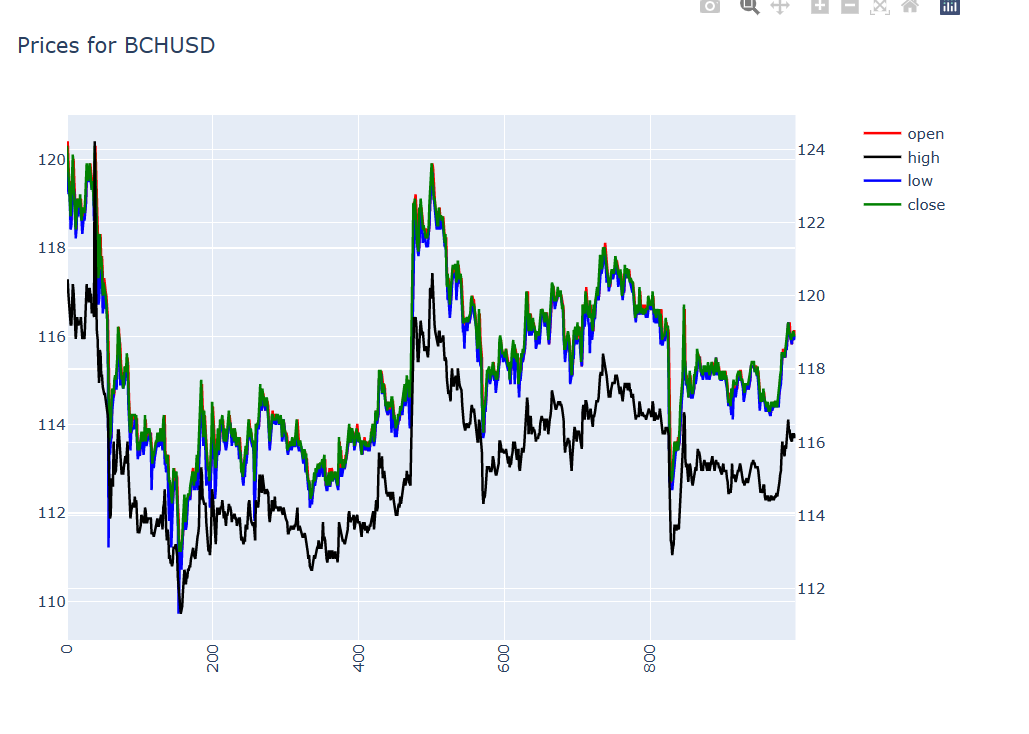
longitud=np.arange(len(data_raw))
                trace1 = go.Scatter(
                    x =longitud,
                    y = data_raw['open'],
                    name='open',
                    marker=dict(
                        color='red'
                        )
                )

                trace2 = go.Scatter(
                    x =longitud,
                    y = data_raw['high'],
                    name='high',
                    marker=dict(
                        color='black'
                        )
                )

                trace3 = go.Scatter(
                    x = longitud,
                    y = data_raw['low'],
                    name='low',
                    marker=dict(
                        color='blue'
                        )
                )

                trace4 = go.Scatter(
                    x = longitud,
                    y = data_raw['close'],
                    name='close',
                    marker=dict(
                        color='green'
                        )
                )

                fig = make_subplots(specs=[[{"secondary_y": True}]])
                fig.add_trace(trace1)
                fig.add_trace(trace2,secondary_y=True)
                fig.add_trace(trace3)
                fig.add_trace(trace4)
                fig['layout'].update(height = 600, width = 800, title = symbol,xaxis=dict(
                    tickangle=-90
                    ))


                fig.update_layout(
                    title = 'Prices for '+str(symbol),
                    xaxis_tickformat = '%d %B (%a)<br>%Y'
                )

                fig.show()
- Free trading apps
- Over 8,000 signals for copying
- Economic news for exploring financial markets
You agree to website policy and terms of use
hi
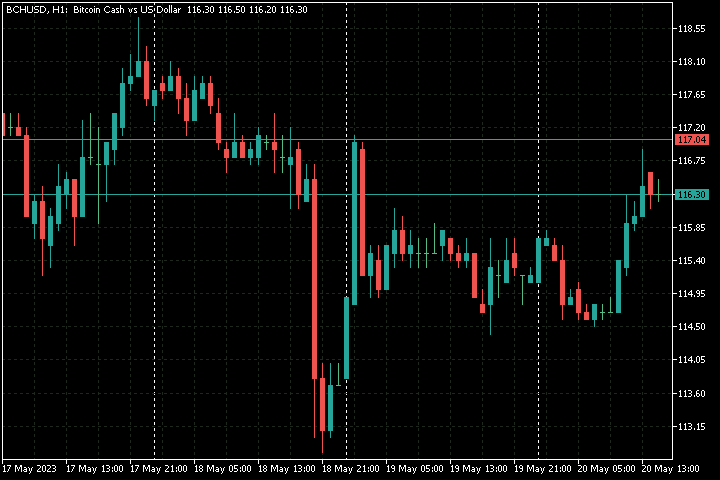
I'm getting data from mt5 (robomarkets (RoboForex))
and the data is shown here:
in the last 1000 ticks ... the high has only been higher a few times
why am I getting theese results?
this is what I use: mt5 with python