Looking for indicator that gives the info tp of the globality of open trades please
Hello, to be a little more specific about my request, I would like someone to tell me and mark on the graph where the price must go to reach my overall position tp but the sell and buy each separate their tp
thank you
You need a custom utility for that, you may search for one in the Market or order it in the Freelance section.
Discussion and recommendations about products are not allowed in the forum.
Your question is difficult to understand, but I will attempt to explain a few things that might answer you.
- A Buy order will open on the Ask quote price, but it will close at the Bid quote price (stop-loss or take-profit).
- A Sell order will open on the Bid quote price, but it will close at the Ask quote price (stop-loss or take-profit).
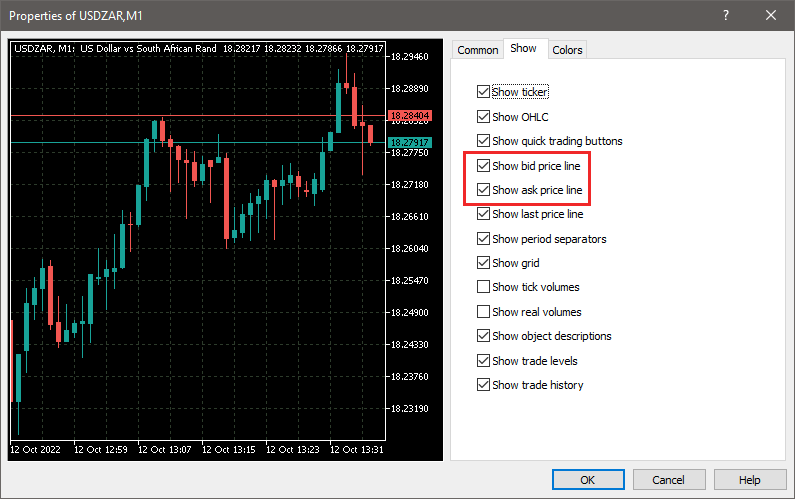
However, a chart on MetaTrader only shows the OHLC data based on Bid quote prices. So the target exit prices for Sell positions is not very clearly identifiable on the chart if you only monitor the Bid prices.
So, to help see it better, enable the Ask line on your chart, so that you can see both the current Bid line as well as the Ask line.
I want him to give me the information as I open a new position.
my EA already closes automatically when it comes to the profit request from the global position but I don't know how much the Trades have to cover before closing when there are more positions in the same direction with different entry points
Assuming you are talking about multiple positions on the same symbol, then your EA will need to be modified to calculate the "net" result of the basket and draw the target price on the chart.
If however, you are talking about multiple positions on different symbols, then it will not be possible to define target prices for each, as the target is based on overall profit in "money" and not in price target.
I'm talking about the same symbol ( dax )
example:
10 open position in buy at different prices
5 open position for sale at different prices
my EA automatically closes the purchase when all the purchase positions reach 5 euros in overall profit from all the purchase positions and the same for the sales
I would like it to mark me on the graph as it opens other positions the new global tp 5 euros for purchases and also for sales
No such indicator exists as far as I known. It will have to be coded (use the Freelance section), but it will be easier to just have your existing EA be modified to show that target on the chart using the following maths:

- vi = volume of individual position
- oi = open price of individual position
- ci = close price of individual position
- Vn = total volume for a basket of positions
- On = net mean open price for a basket of positions
- Cn = net mean close price for a basket of positions
- PLn = profit/loss for a basket of positions

- 2022.10.12
- www.mql5.com
No such indicator exists as far as I known. It will have to be coded (use the Freelance section), but it will be easier to just have your existing EA be modified to show that target on the chart using the following maths:
- vi = volume of individual position
- oi = open price of individual position
- ci = close price of individual position
- Vn = total volume for a basket of positions
- On = net mean open price for a basket of positions
- Cn = net mean close price for a basket of positions
- PLn = profit/loss for a basket of positions
I guess this is for 1 instrument trade only, right?
- Free trading apps
- Over 8,000 signals for copying
- Economic news for exploring financial markets
You agree to website policy and terms of use
thank you