Discussion of article "Multiple indicators on one chart (Part 04): Advancing to an Expert Advisor"
New article Multiple indicators on one chart (Part 04): Starting with EA has been published:
Author: Daniel Jose
Hi Daniel, I've been following your articles, but what about Part 03?
There was a small problem at the time of requesting the release for publication, but I have already authorised the publication of Part 03, it will soon be available too, this problem was caused more by the number of articles I have already sent ... there are currently another 15 articles for them to analyse, all of them involved in the development of this EA and with each one things get more and more complex .... but thank you for following the series ... look forward to lots of new stuff from article 05 onwards, from then on it's really going to be worthwhile because it's going to become something big, these first few are just to introduce you to what's to come...😁👍
Hi Daniel,
I am having problems with multicolored indicators and your articles, which I am enjoying, indicate that you might know its solution.
I want to produce a function that sets all of the indicator attributes without using the #property options,e.g. #property indicator_color1 clrCrimson,clrWhite,clrLime
What I am finding in the test program below is that with the #property indicator_color1 clrCrimson,clrWhite,clrLime included, the program works properly whereas if I comment it out, then the program doesn't perform correctly. In this case it seems that it is plotting only some of the data points as if it is using a "higher?" time frame or skipping several data points. I suspect that the property color directive is setting more attributes that I have not identified when multi colors are specified.
The second problem is that I obviously don't understand the details and requirements of using multicolored plots. I have searched the documentation and have not found any articles that provide an overview of how to use multi colored indicators. While the first plot changes color correctly, the second one, plotting the lows, does not change colors according to my function call. This plot requires all three properties: type2, color2, & width2, to operate properly. I am also perplexed why the property declarations use 2 instead of 3. I used Mladen's Laguerre Adaptive Filter indicator to identify that the property indicators use the plot number,2, not the indicator number 3 to display correctly.
Any suggestions, references, or help will be greatly appreciated
Regards, CapeCoddah
Hi Daniel,
I'm having problems with multicolored indicators and your articles, which I'm enjoying, indicate that you might know your solution.
I want to produce a function that sets all indicator attributes without using #property options eg #property indicator_color1 clrCrimson,clrWhite,clrLime
What I'm finding in the test program below is that with the #property Indicator_color1 clrCrimson,clrWhite,clrLime included, the program works correctly, whereas if I comment it out, the program doesn't work correctly. In this case, it looks like it's only plotting some of the data points as if it were using a "larger?" time period or skipping multiple data points. I suspect the property's color directive is defining more attributes that I haven't identified when multiple colors are specified.
The second problem is that I obviously don't understand the details and requirements of using multicolor graphics. I searched the documentation and didn't find any articles that provide an overview of how to usemulticolored indicators . While the first graph changes color correctly, the second one, tracing the low points, doesn't change color according to my function call. This graphic requires all three properties: type2, color2, and width2, to work properly. I'm also puzzled why property declarations use 2 instead of 3. I used Mladen's Laguerre Adaptive Filter indicator to identify that property indicators use chart number 2, not indicator number 3 to display correctly.
Any suggestions, references or help will be greatly appreciated.
Sincerely, CapeCoddah
You're a little confused, I can understand... but all the confusion is in the fact that you're not actually looking at the details in your code. I'll try to explain some of the details that are in the comment, then I'll talk a little about your code....
The first point is that you can even produce a multicolored indicator without using #property indicator_colorN but for the user and even for you it is more practical, safer and simpler to understand and modify the code, because all you have to do is going to the properties is to modify the colors present there, and for the user it is simpler because he will only have to choose the color to be modified and make the change, this in the standard window that MT5 creates for the indicators. You are somehow already doing the right thing when using the PlotIndexSetInteger command to generate the color changes, and this is the way when we don't use #property indicator_colorN , but when we use the properties it often doesn't make sense to use the PlotIndexSetInteger command to set other colors, this is because the thing can be more complicated to maintain and more confusing for the user, since he may not really understand what the color standard is trying to say, even if the code is yours and you will be the the only one to use the indicator, it doesn't make much sense, unless in rare cases you create a dynamic color pattern.
Now about the second point: The problem in this case is that you are confusing the number of things that the indicator will plot ( 2 for 2 lines ) with the object properties ( in this case line ) and for the line to be plotted, you actually need to declare at least 3 pieces of information, which are TypeN, ColorN, WidthN , where the N indicates the number of the object, with practice and time you will end up understanding these small differences between the indicator property and the properties of the objects he uses... Don't give up... keep studying and soon things will become clearer... 😁👍
Now let's see some of your code... I'm not going to show you exactly how to fix it (if I do this it won't be fun... .... 😁👍✌ ) I want you to pay attention to the following fact, and this is important:
      Buf=Set_IndexBuffer5(Buf, dataHi, INDICATOR_DATA , DRAW_COLOR_LINE , 4 ,
"High" , clrYellow , clrWhite , clrDodgerBlue );
      Buf=Set_IndexBuffer5(Buf, dataHic, INDICATOR_COLOR_INDEX );
      Buf=Set_IndexBuffer5(Buf, dataLo, INDICATOR_DATA , DRAW_COLOR_LINE , 4 ,
"Low" , clrYellow , clrWhite , clrDodgerBlue );
      Buf=Set_IndexBuffer5(Buf, dataLoc, INDICATOR_COLOR_INDEX );
Note that I marked two things in your code... now let's see what is happening when it is played on the graph....
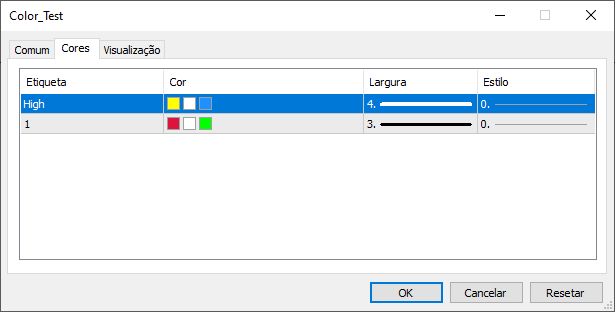
See that only one of the labels is as you declared in the code, only the HIGH .... and the LOW ?!?! where is she ?!?! this is the first point you should correct, because the fact that the LOW tag is not being shown indicates that the color pattern being used is what is declared in #property indicator_color2 , that is, you have a failure at this point , if you try to remove the properties of indicator 2 that actually create the LOW line, even keeping the rest of the code, the HIGH line will be plotted, but the LOW line will not....why?!?! because in fact you are not defining the information necessary to plot the LOW line, this dynamically via the use of the PlotIndexSetInteger call ... it seems strange .. but this is what is happening ....
When you manage to fix this, if you really want to use the dynamic way of declaring the data of the row object using PlotIndexSetInteger, you will be able to remove the #property indicator_color compilation commands from the scene, as the necessary data will be set dynamically, but if you don't want to make such an effort, that's fine....
Now I want you to look at the image above and compare it with the colors you are using in #property indicator_color ... watch these colors very carefully .... if you do this you will notice something strange there .... again I won't say not to lose the fun, but try to use different colors, without repeating any of them... when you repeat them it gets harder to understand where the mistake is... 😁👍
Now one last detail: The fact that you think he is plotting only some points and skipping others can be for two reasons: The color pattern is not contrasting with the background of the graph, try to use colors that contrast with the background of the graph, and the second, but I don't believe it is actually the case, is that there may be a failure in the OnCalcule event, you are returning -1 or the value of i, the correct thing is to return rates_total, so change this in the code to avoid problems futures...
Hi Daniel,
I was confused. I thought the drawing characteristics were defined using the buffer specification like MQ4 whereas, for at least DRAW_COLOR... specifications the drawing characteristics are defined using the sequential plot identifier. I have not determined if the DRAW_LINE etc also require plot specifications. Moreover, the indicator_colorX property actually has two functions, first to count and set the number of colors and then to set each specified color into its proper array position. I am attaching two files, Color Test which is now operating correctly although, it requires more refinements, secondly MLADEN's MACD Original2_1 slightly modified. Mladen's program is interesting as he had defined two plots but only uses one color index buffer.
Thanks for your assistance
- Free trading apps
- Over 8,000 signals for copying
- Economic news for exploring financial markets
You agree to website policy and terms of use
New article Multiple indicators on one chart (Part 04): Advancing to an Expert Advisor has been published:
In my previous articles, I have explained how to create an indicator with multiple subwindows, which becomes interesting when using custom indicators. This time we will see how to add multiple windows to an Expert Advisor.
When I decided to create something new using OOP (Object Oriented Programming), I did this because I already knew that there are big advantages to using this approach, including security and inheritance. There is also polymorphism, but we will use it later when creating a cross-order system. In this particular case we will use one of the advantages of OOP - inheritance. C_TemplateChart is already a fully functional class. Seeing this, you wouldn't want to have the trouble of reprogramming everything again or run the risk of adding code to the class while this would prevent the class from being used in other places. The solution is to use inheritance which allows the addition of new code or function without changing the original code at all.
Using inheritance has a number of advantages, including the following: already tested code remains tested; complexity grows without an equal increase in code size; only new features really need to be tested; what does not change is simply inherited, providing stability. In other words, things improve with minimal effort, but with maximum security. To understand this, let's look at the diagram below.
Author: Daniel Jose