I need to interpolate a function with arbitrary settings, so I chose splines.
I understand correctly that I will get different interpolants by the number of node points, what else can I vary?
And the second question, what is better to choose for interpolation from the list, if I just need to build many different interpolations of the original series (variation is important)
Which is better to choose is a very tricky question. One approach, called empirical risk minimisation, is developed in Wapnick's book Algorithms and Dependency Recovery Programs. 1972, it seems.
Which is the better choice is a very tricky question. One approach, called empirical risk minimization, is developed in Wapnick's book "Algorithms and programs for dependence reconstruction". It seems to be 1972.
Likelihood maximization/minimization of empirical risk, as I understand it, is just a general name for the corresponding algorithms. I don't need algorithm itself, I just need to modify curves, preferably quickly and variably, with possibility to find interpolant values on new points (spline package allows the latter).
Likelihood maximization/minimization of empirical risk, as I understand it, is just a general name for the corresponding algorithms. I don't need algorithm itself, I just need to modify curves, preferably fast and variable, with possibility to find interpolant values on new points (spline package allows the latter)
Both maximum likelihood method and minimization (I remember, not empirical, but average) risk are names not of algorithms, but ways of goal setting in problem setting. If the goal is achievable, it gives rise to some algorithm that is necessarily consistent with the goal, is an implementation of its achievement in particular cases. If you don't need either goals or algorithms to achieve them, no advice can be given for the task of choosing interpolating functions. You are left to choose as your heart tells you...
I need to interpolate a function with arbitrary settings, so I chose splines.
I understand correctly that I will get different interpolants by the number of node points, what else can I vary?
And the second question, what should I select for interpolation from the list, if I only need to build many different interpolations of the initial series (variability is important)?
The most valuable for a trader is not interpolation and not approximation, but extrapolation.
Splines are not suitable for extrapolation.
I have great experience and understanding in polynomial approximation-extrapolation. Less experience is Fourier.
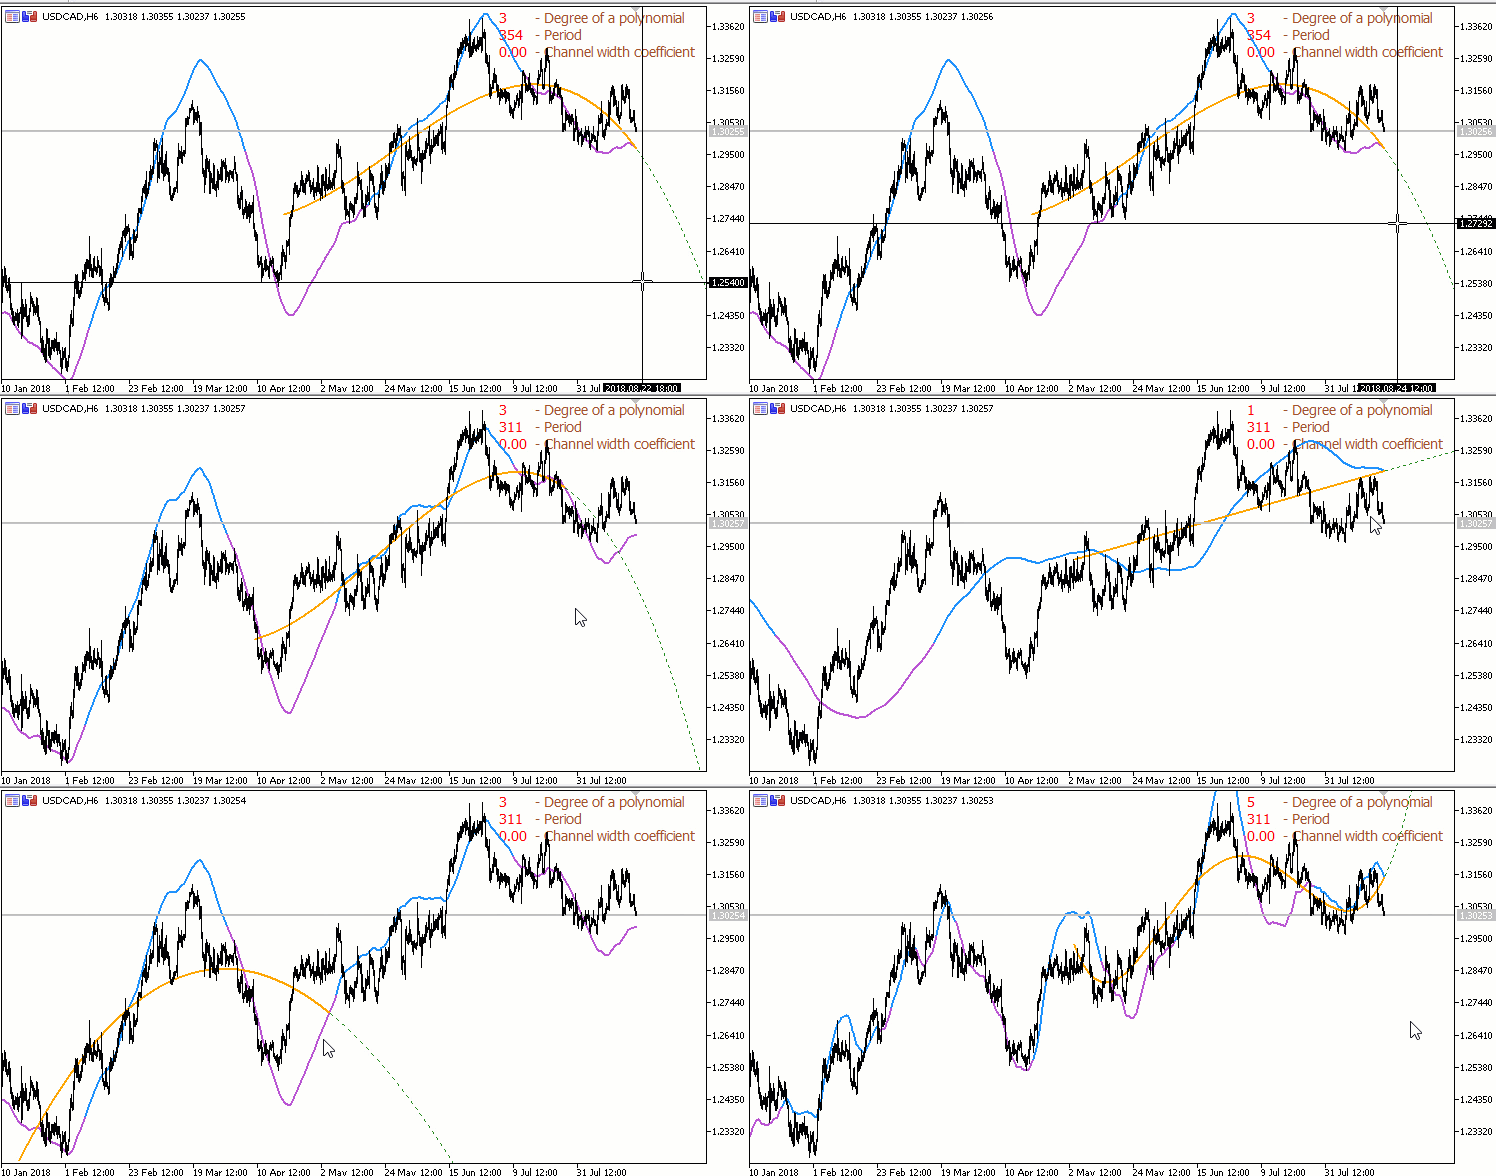
Extrapolation by polynomial and Fourier methods are completely different in nature. Fourier extrapolation can be applied only to the flat market due to its periodic nature (this line is a sum of sinusoids of different frequency, phase and amplitude), and it always tends to go back,whereas polynomial extrapolation, on the contrary, is good for the trend, as it always tries to "fly up" or down due to its degree nature.
Therefore, it makes sense to combine these two methods for good extrapolation results.
The polynomial approximation is of particular interest for programmers because this type of approximation is very well optimized and can be calculated very quickly. I managed to get out of cycles for calculation of coefficients.
It is also important to remember that all types of approximation create redrawable lines with each new point. Only the tracer from the approximating line is not redrawn.
A polynomial approximation has only one solution as opposed to a Fourier approximation. This allows the creation of unique non redrawable slides:
I see, guessing at random isn't bad either. So no one has solved similar problems. I'll visualise it, I'll see.
No one has solved it - wrong. All interpolation methods have their theoretical justification and usually a clear objective. For example, cubic defect two splines minimize the potential energy of elastic bending of a ruler passing through the nails hammered into the board at the nodes of the spline. In this way, a smooth (defect less than 3) curve was obtained from a table of points in a drawing with a ship's outline or a wing profile. The same splines depict the deflection of a multi-support beam in resilient mathematics. Very often the goal is to minimize the sum of coordinate deflections at interpolation nodes. To compare the results of interpolation with different goals one needs a generalizing goal, a criterion which is computable for any interpolation method. It is based on the number of coefficients to be determined. Roughly speaking, if a polynomial approximation with an increase in polynomial degree from 3 to 7 reduces the sum of squares of deviation by 20%, then degree 3 is more reasonable than 7. The analogue in radio engineering, if I am not confused, is the filter cut-off frequency.
The most valuable thing for a trader is not interpolation or approximation, but extrapolation.
Splines are not suitable for extrapolation.
I have great experience and understanding in polynomial approximation-extrapolation. Less experience - Fourier.
Extrapolation by polynomial and Fourier methods are completely different in nature. Fourier extrapolation can be applied only to the flat market due to its periodic nature (this line is a sum of sinusoids of different frequency, phase and amplitude), and it always tends to go back,whereas polynomial extrapolation, on the contrary, is good for the trend, as it always tries to "fly up" or down due to its degree nature.
Therefore, it makes sense to combine these two methods for good extrapolation results.
The polynomial approximation is of particular interest for programmers because this type of approximation is very well optimized and can be calculated very quickly. I managed to get out of cycles for calculation of coefficients.
It is also important to remember that all types of approximation create redrawable lines with each new point. Only the tracer from the approximating line is not redrawn.
A polynomial approximation has only one solution as opposed to a Fourier approximation. This allows the creation of unique non redrawable slides:
That's fine. I have nothing to extrapolate, it is interpolation that is needed. I mean that it makes no sense to make a forecast on the basis of such extrapolation. It is necessary that this line should be as strong as possible, from side to side, like your blue line. And I want to be able to get a solution on the new points, yes (without re-calculating on the basis of the existing formula).
So just asked what's better to use - polynomials or splines or some subspecies. And maybe the 10th degree would be fun too.
No one has solved it - it's wrong. All interpolation methods have their theoretical justification and usually a clear objective. For example, cubic defect two splines minimize potential energy of elastic bending of a ruler passing through nails hammered into the board at nodes of the spline. In this way, a smooth (defect less than 3) curve was obtained from a table of points in a drawing with a ship's outline or a wing profile. The same splines depict the deflection of a multi-support beam in resilient mathematics. Very often the goal is to minimize the sum of coordinate deflections at interpolation nodes. To compare the results of interpolation with different goals one needs a generalizing goal, a criterion which is computable for any interpolation method. It is based on the number of coefficients to be determined. Roughly speaking, if a polynomial approximation with an increase in polynomial degree from 3 to 7 reduces the sum of squares of deviation by 20%, then degree 3 is more reasonable than 7. The analogue in radio engineering, if I am not confused, is the filter cut-off frequency.
It's just that if I start trying to explain everything I'm going to do with it, it's going to be a few pages long again :) You need variability, different degrees of polynomials, number of grid points, etc.
That's fine. I have nothing to extrapolate, it is interpolation that is needed. In the sense that a forecast on such an extrapolation is meaningless to make afterwards. It is necessary that this line should be as strong as possible, from side to side, like your blue one. And I want to be able to get a solution on the new points, yes (without re-calculating on the basis of the existing formula).
So just asked what's better to use - polynomials or splines or some subspecies. And maybe the 10th degree would be cool too.
Exactly interpolation? Are you sure? Not approximation? And it's not redrawable?
You're not going to interpolate every tick.
If you need interpolation on intermediate nodes (ZigZag nodes for example) without redrawing, then the whole point is where the next node will be.
You can only create a non redrawable clear ZigZag if you have a time machine. There is no way you can determine without a time machine that the current bar is an extremum.
There is someone on the forum periodically who I call a "tail-drawer".
The whole point is the ponytail.
It is a classic of this genre - to shift the SMA to the left by half a period and finish drawing those half-periods as if by accident with a polynomial of some degree. For examplehttps://www.mql5.com/ru/forum/224374. You have probably already seen it.
You can do a very nice interpolation along zigzag extrema with splines, but you need to clearly understand that between the last two or three nodes there will be redrawing. There is no way without it!
If not redrawn, it's not interpolation, but what I call a trace from the approximating line (not interpolation!).
Apart from polynomials, I don't see anything comprehensible so far.
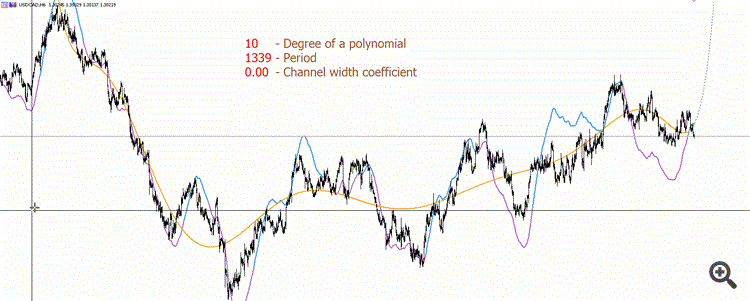
Here's a specially recorded a gif to demonstrate an example of polynomial of higher degree (10), in order to understand how much less "beautiful" it is than I would like :))
The purple and blue line is not redrawable. Purple is the polynomial "looking down", blue is the polynomial "looking up".
And there is not enough precision to calculate high degree polynomials. We will have to use special libraries using types of higher precision. The fact that the "tracer" starts "jumping" at small periods in the gif - this is the reason why double lacks precision.
But personally I do not see the practical application of polynomials of degree over 5.
- Free trading apps
- Over 8,000 signals for copying
- Economic news for exploring financial markets
You agree to website policy and terms of use

I need to interpolate a function with arbitrary settings, so I chose splines.
I understand correctly that I will get different interpolants by the number of node points, what else can I vary?
And the second question, what is better to choose for interpolation from the list, if I just need to build many different interpolations of the original series (variation is important)