
You are missing trading opportunities:
- Free trading apps
- Over 8,000 signals for copying
- Economic news for exploring financial markets
Registration
Log in
You agree to website policy and terms of use
If you do not have an account, please register
Hi all, I am writing an EA. The essence is this - opens two differently directed stop orders when one of them triggers the second is deleted, but in the tester is deleted only buy order when trying to delete sellstop comes out 4108 error incorrect ticket. Please help me to understand this. Inserted a function that deletes the order.
Thanks in advance!!!
{
int dell;
for(int i=OrdersTotal() -1; i>=0; i--)
{
if(OrderSelect(i,SELECT_BY_POS,MODE_TRADES))
{
if(OrderSymbol()==Symbol() && OrderMagicNumber()==Magic)
{
if(OrderType()==OP_SELLSTOP && CountBuyDell()>0)
dell=OrderDelete(OrderTicket());
if(!dell)
{
Print("Ордер SellStop не удален");
}
}
}
}
return;
}
Greetings. Please advise how to take data from the indicator.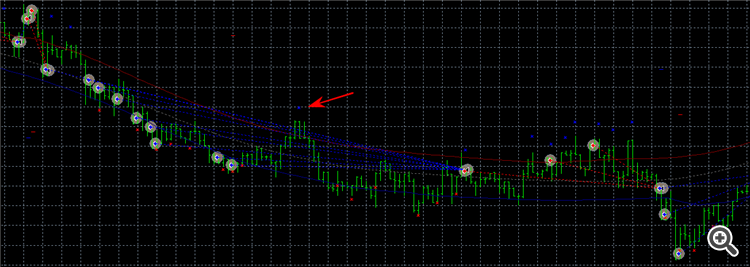
Need data from the red and blue icons. There are some astronomical values in the respective buffers when there is no drawing. I have limited them to a number of 10000. Seems to work, but there are skipping signals. How to fix it? Here is how I messed up:
Greetings. Can you tell me how to get the correct data from the indicator.
I need data from the red and blue icons. There are some astronomical values in the respective buffers when there is no drawing. I have limited them to a number of 10000. It seems to work, but there are skipping signals. How to fix it? Here is how I messed up:
I haven't looked into the code, but I can assume this will help. I may be wrong:
if (PriceLow1!=INT_MAX) PriceLow=PriceLow1; else PriceLow=0;
Didn't look into the code, but I can assume it will help. I could be wrong:
if (PriceLow1!=INT_MAX) PriceLow=PriceLow1; else PriceLow=0;
Thank you for not going through, but it didn't help.
ArraySearchDouble() and EquationDirect()in old version of mql 4. And the new version has any analogues.
Please advise how best to work with data - given a number series, which will be divided into subgroups depending on the results of the calculation, these groups should be stored in an array, in addition, each group will have two or more indicators per group (a group of numbers separately will belong to the calculated figure). The data shall look as follows
1/1,2,3,4/23/33
2/1,4,5/26/11
3/3,4,5,33,56,38/21/44
and so on