The Sultonov Regression Model (SRM) - claiming to be a mathematical model of the market. - page 20
You are missing trading opportunities:
- Free trading apps
- Over 8,000 signals for copying
- Economic news for exploring financial markets
Registration
Log in
You agree to website policy and terms of use
If you do not have an account, please register
Or Alexei's filter cascade https://www.mql5.com/ru/forum/137042/page47.
He shares the process too. What's not being laughed at?
And where can I see econometric models in action, i.e. reports on forex trading?
Who needs it?
There was a book by Brukow called How to Predict the Dollar Rate. And so.... with great difficulty to build a model, what to share. My branch "Econometrics: predicting one step ahead" has a detailed look at the process of building a model. I offered to participate, I took on the rough work, but no one was interested. I abandoned it half-way: I built the model, but did not make forecasts.
The development of the model is a tedious and very extensive testing and calculation work, which involves the use of specialized packages. If there are constructive participants I will participate, but otherwise, look at the beginning of the thread - nothing but ridicule of ignorant people.
Begone, you sotona.
I ask the moderators to punish, for insulting me.
A second question, very short: how do you use the indicator?
Ehhh . I'd like to answer that, but I can't. I'll get banned. First you have to roll it up into a tube, then find the author .
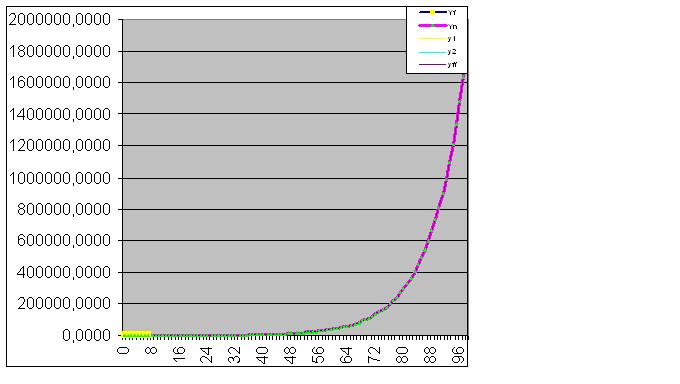
Exponent Y =100 e^(0.1x), model error 4.78345E-05%

Inverse exponent Y = 100 e^(-0.1x)? model error 7.32898E-08%
I ask the moderators to punish, for the insult.
What is the insult ???
"Sotona" (slang) is not an offensive word and does not carry a derogatory meaning
According to Slovoovo, Sotona is.
Употребляется в положительном значении – умный человек, смешной.
Yusuf, please explain as if you were explaining to a schoolboy (to make it clear) how to use, what the lines are, why, what they show etc....
Yusuf, please explain as if you were explaining to a schoolboy (to be clear) how to use, what the lines are, why, what they show, etc....
Decline will continue along the orange line. There is no clear sell-off, a correction along the orange line is possible. The thin lines indicate bullish and bearish potentials that could be triggered at the right time. However, traders can safely stick to the thick orange "trader's line" for now. If you put N=0 in the settings, the trader line "comes alive" reacting to each tick. In short.
I understand ktn's notion of colours is scientific, BUT. WHERE is the orange line?
I understand the Ktn's concept of colours is scientific, BUT. WHERE is the orange line?