The Sultonov Regression Model (SRM) - claiming to be a mathematical model of the market.
searching for patterns, describing the main patterns
All the basic assumptions of correlation and regression theory are based on the assumption that the data under study is normally distributed. Do your inputs (price) have a normal distribution?
All the basic assumptions of correlation and regression theory are based on the assumption that the data under study is normally distributed. Do your inputs (price) have a normal distribution?
didn't get it
In principle, I will show that RMS detects any pattern embedded in a series of digits, including time series (RT), I think, regardless of the nature of the appearance of those digits in the series. All these and other subtleties will be discussed using concrete examples, including random series analysis.
RMS will find a valid or fictitious pattern, but due to lack of distribution normality the predictive value of the model will be 0. These are not subtleties, this is the foundation.
What, exactly, didn't you understand?
RMS will find a real or imaginary pattern, but due to the lack of normality of the distribution, the predictive value of the model will be 0. This is not subtlety, it is the foundation.
RMS will find the most adequate dependence, rather than a derived dependence. And about absence or presence of normality of distribution of initial data let's open separate discussion and let experts of this base to speak here in parallel.
Got it..... And right - forget it, normality! It just gets in the way.
P.S. The predictive value of the model will be close to 0
Let's start with a linear function.
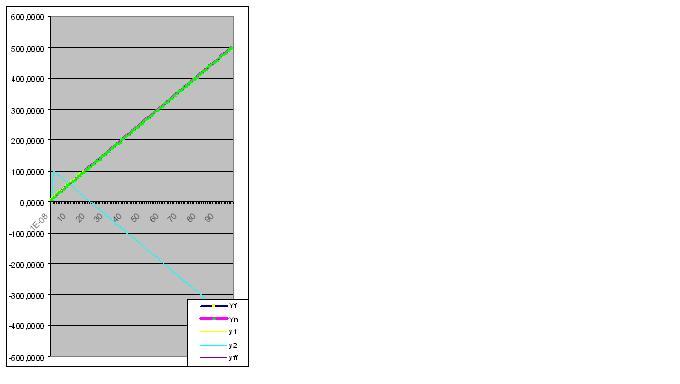
Let's imagine that the series is given by the numbers Yi = a+bxi:
xi Yi
0,00000001 10,0000
1,00000001 15,0000
2,00000001 20,0000
3,00000001 25,0000
4,00000001 30,0000
5,00000001 35,0000
6,00000001 40,0000
7,00000001 45,0000
8,00000001 50,0000
9,00000001 55,0000
10,00000001 60,0000
11,00000001 65,0000
12,00000001 70,0000
13,00000001 75,0000
14,00000001 80,0000
15,00000001 85,0000
16,00000001 90,0000
17,00000001 95,0000
18,00000001 100,0000
Here is a graph of the actual and calculated values, the model error is 2.78163E-14%:
Got it..... And rightly so - screw it, normality! It only gets in the way.
P.S. the predictive value of the model will be close to 0
Because of your persistence, I have to begin by demonstrating the predictive ability of the model by analyzing the function Y=tg(0,1x)+2 and introducing the first 8 pairs of digits:
xi Yi
0,00000001 2,0000
1,00000001 2,1003
2,00000001 2,2027
3,00000001 2,3093
4,00000001 2,4228
5,00000001 2,5463
6,00000001 2,6841
7,00000001 2,8423
Error 0.427140953%:

However, once the 9th pair of digits is entered, the model immediately predicts about the "strange" behaviour of the object in the future:

Further data entry brings the predicted "anomaly" closer to the original data:


Here the raw data has also begun to perform the predicted "feint":

Finally, the prediction is perfectly fulfilled:

Next, the model perfectly catches the final state of the object, so that the sum of the actual values of the function equals the calculated RMS with computer accuracy

- Free trading apps
- Over 8,000 signals for copying
- Economic news for exploring financial markets
You agree to website policy and terms of use
Dear forum members, it is no secret that the question of finding the dependencies that describe the basic patterns of the market is an important one. Here we will try to approach this question by all available means of analysis, including various proposals of the participants on this matter and the theoretical and practical material accumulated by this moment from all possible sources. As a result of this work, if we dwell even on just a view of this function, I think we will consider that time and effort have not been spent in vain.
I will begin by demonstrating the capabilities of RMS with simple examples of descriptions of well-known patterns: linear, parabola, hyperbola, exponent, sine, cosine, tangent, cotangent and others, as well as their combination, which are certainly present in the market. Please support me in this impulse with constructive suggestions and healthy criticism if required.