Searching for market patterns - page 9
You are missing trading opportunities:
- Free trading apps
- Over 8,000 signals for copying
- Economic news for exploring financial markets
Registration
Log in
You agree to website policy and terms of use
If you do not have an account, please register
these are the differences so far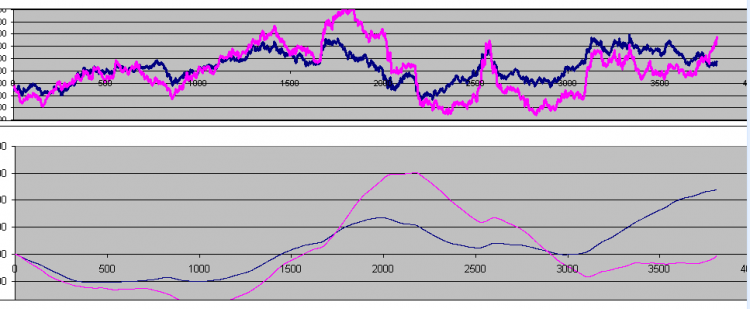
underneath - these are the reverse reconstructed ....
I'm a watery, I'm a watery... someone should talk to me....))))
Slightly off-topic)). I was scalping and tried a dozen different brokerage firms. So, all of them have very different minutes, some of them are prickly, others are smooth, others are just slow. They often have price differences up to 30-100 points (on five digits). I do not understand how one can become a rider.
So I do not understand how you can analyse them.
Just giving my opinion.....