[Branch closed!] EURUSD - Trends, Forecasts and Consequences (Episode 4) - page 215
You are missing trading opportunities:
- Free trading apps
- Over 8,000 signals for copying
- Economic news for exploring financial markets
Registration
Log in
You agree to website policy and terms of use
If you do not have an account, please register
And this is what I got. The yellow lines are the entry and exit points.
There are significant drawdowns, but they are not bad either.
It shows what we should have done this morning and in what direction we should have gone.
It's all so smart on the history - in fact, there are a lot of false breakdowns, false trends and so on - now the most likely it's waiting for the sell - to go up, it happened 20 times.)
They'll draw you a beautiful bottom - the top to take away your hard-earned money))
It's so great on the history - in fact, there are a lot of false breakdowns, false trends, etc. - now the most likely it will be waiting for them to sell - that would then shoot up - it has already been done 20 times - the euro market makers are firing up like this - I showed you)))
I liked the adjustable filter there for now and it needs serious adjustments.
I like the adjustable filter there for now and it needs some serious adjustments.
You can't make millions with them - why do you think I started studying gann and crowd-feeding? That's where the real money is.
And the indicators - only reflect what was - except levels and pivot points and again on history - so it is better to trend - rainbows do everything
PS /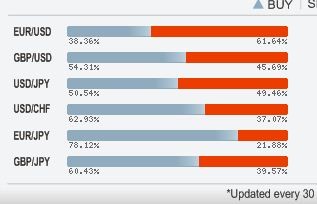 already have 60% of victims - we will stand until 70 and then we will drain their stops ) like on the Euro - Yen
It's funny how the price bounces off the levels.
Fibonacci fan is drawn automatically
It bounces more off of Gann levels - and breaks through too + if a fan + this then I think the bunch would be atzc -
levels based on the square --- price always goes to the corner or comes back to it -
So now it will go to 441 and then storm 421 ) Either a sub-wave of 436 which is already going
On the euro pound a rollback has ended - from a red zone can go upwards on a rainbow up - now there are 64 % in well
It bounces more off of Gann levels - and breaks through too + if a fan + this then I think the bunch would be an attic -
levels based on the square --- price always goes to the corner or comes back to it -
Yeah, I noticed that.
Now EUR GBP will be dumped )) who are in the sell - if we take trends and moon, we still have 6 days
There are no buy victims from the bottom = but there are a lot of SELL victims - we will probably dump them - and there are a lot of buys in the orders - but right now 60% are in the open
About Gunn levels, what started the trend for the Euro ?with a breakdown of Gunn levels 421 - then it was like support then 431 - then the corner of 441 !
You need to shovel profits knowing these things - note - the middle of the channel is a correction - and it is so accurate that the point to point )) the support fractal is right in the middle of it - maybe when it is a sell fractal resistance will be in the middle
They use the money to shoot music videos at the Currency and Stock Exchange Centre in London.(No translation). Singing along to Thomas Anders I won't...
>
Bravo!!! You've got it all figured out..... even you didn't let the market makers get wise.... You're right about a lot of things..... All that's left is to learn how to communicate respectfully and get elected president over hamsters ))))
The only difference is that ... even if we try to look for a pattern in the end there are much better machines than these simple ones that reverse much faster and show a possible trend end or entry into a long tedious flat.
Here are some screens with much more interesting than simple SMAs
odiseif:
Миксон,у меня к тебе вопрос .Предположим у твоей радуги самый большой период сиреневой машки 200 ....С чего ты взял что цена именно там должна отскочить а не чуть ниже где стоит машка с периодом 210 которая у тебя в радуге какбы уже нету ..
BLAH BLAH BLAH !
My theory and trading is based on chaos theory - and chaos takes absolutely everything into account !
Now, tell me more about it - or what is it? - Secondly, there is no pattern in the form of support and resistance - it's a myth that we should be losing hamsters.
If you do not know what chaos is and how to use it - you can read it in the books of Bill Williams - in the stock market, I'm doing great - at Gazprom and the Savings Bank I made 5% of the deposit for this week - but the foreign exchange market has different rules, other tools and the same strategy - but in a "new guise" - here's an example - the euro yen - and my methods
Breakout - pullback - breakout -
backwards breakout - breakout -
pullback - pullback - breakout
Reversals only to the rainbow side - breakdowns only from the rainbow side - write it down in a notebook and find out what phase the market is in - in a pullback or breakdown - so to speak.
Anyway, I'm too lazy to tell you - I told you everything a long time ago --------.
But I will tell you one thing - nothing has been invented better than wipers -
Give up the wipers )))))) I'm all for it - I wanted to get rid of them myself - but the search for the grail is coming to an end - make conclusions - big money only from this - if you want to make a penny, study thechanalysis - wave analysis and other nonsense - I got out of it - long ago = but sometimes like a fool to believe it, in news analysis in peters - and the like - but it quickly passes - but I'm not so sure.
I told you what I profit from - you'd better not agree with me - I'm too lazy to breed competitors)
Ah yes - I almost forgot - I decided to show you the USD JPY - I took a lot of profits there - based on a breakdown - pullback - breakdown of the pullback - I do not care which way the market goes - as long as it is not flat)
Thus, the whole month of stable profit under the rainbow is great. - Come on - what am I telling you here?
+ I have a notebook with the nature of each pair - the impact on the news - my own statistics about the whole affair.
All methods are good, no argument - a good doctor can't be a good fisherman or a good writer - he has only one way -
THE END )