Interesting advisor!!!!!
People keep up with the monkeys for one simple reason: the first profitable trade repays all the drawdown and results in a profit. It is not only possible but necessary to use it, provided that the ratio of profitable entries to unprofitable ones is at least 3 to 1 and there are no series of losing trades more than 3 over a couple of years. It can be applied even to trailing trades if you want to.
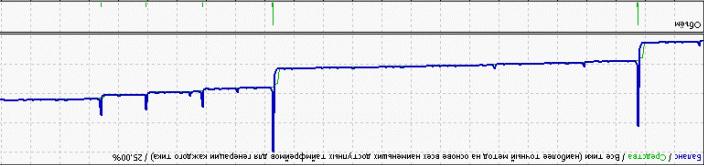
By the way, your lot calculation is wrong if there are steps on the balance chart.
The very first idea is to reduce the number of trades from the series with which the Martin lot increases... if I understand correctly how this EA works.
To give you an example. There is an EA where after the first losing trade the lot is doubled. However, if there are 5 losing trades in a row, the lot will increase 32 times. So, to reduce the load on the deposit, you can increase the lot not after the first losing trade, but after the second one... then it will increase "only" 16 times.
People keep up with the monkeys for one simple reason: the first profitable trade repays all the drawdown and results in a profit. It is not only possible to use it, but also necessary, provided that the ratio of profitable entries to unprofitable ones is at least 3 to 1 and there are no series of losing trades more than 3 over a couple of years. It can be applied even to trailing trades if you want to.
By the way, your lot calculation is wrong if there are steps on the balance chart.
I'll take note of the lot, but I don't understand the 3 to 1, if it's not difficult, as it applies to my specific case and not to martin in general.
The very first idea is to reduce the number of trades from the series with which the Martin lot increases... if I understand correctly how this EA works.
To give you an example. There is an EA where after the first losing trade the lot is doubled. However, if there are 5 losing trades in a row, the lot will increase 32 times. So, to reduce the load on the deposit, you can increase the lot not after the first losing trade, but after the second one... then it will increase "only" 16 times.
I am not doubling the loss, but increasing the lot in trading without stops, so that when I close at stop the loss is less than the profit.
I mean, your case is a loser.
but for more details, why, how, where, etc., I posted it here to find a middle ground in the loss/profit ratio.
Ha!
Martin doesn't work like that. The author takes us for suckers and is great at photoshop and reversed the balance chart picture.
Martin works like this:
Ha!
Martin doesn't work like that. The author takes us for suckers and is great at photoshop and reversed the balance chart picture.
Martin works like this:
I didn't say it was a martin, I said I took the theory of doubling the loss of a martin, and the principle of this EA is a bit different than what you have on the chart, THAT IS NOT A MARTIN. THAT'S NOT THE IDEA AT ALL.
- Free trading apps
- Over 8,000 signals for copying
- Economic news for exploring financial markets
You agree to website policy and terms of use
Good afternoon all, after many days and nights of thinking and searching for a more or less normal strategy, came to the conclusion that all is well that is invented by others, half of the Internet is flooded with information about martin, anti-martin, etc.. I checked it, but the other half of the Internet said it was not profitable, for small profits at great risk, and it's true, having spent a couple of months I was convinced of that, but what interested me was that mostly the system in question is used to cover losses, that is, wait for the price to reverse, so I got the idea, maybe it already had occurred to someone long ago, and even many people know about it, but are assiduously silent about it, So the idea is not to wait until half of the deposit is in the red, to wait for the long-awaited reversal, but as they say put a Martin in a very narrow corridor, as you know, price is mostly moving and can not stand long even if the flute is a CFD, so I put my Martin in a corridor +40\-40 points and of course the profit is staggering, but he is a Martin in Africa, but the wider the corridor the greater the gain, but a wide corridor, Martin also weighs on the balance.
I may have or have ideas how to reduce pressure on the depo and at the same time to make it not killing, but more or less bearable.
I would like to have some ideas how to reduce depo pressure and at the same time to make it not killable, but bearable.
P.S Expert Advisor is in development comments on its internal content is not accepted for "and molded from what was......... "If anyone is willing to help me get my EA up and running I'd be very grateful.