EURUSD - Trends, Forecasts and Implications (Part 2) - page 1482
You are missing trading opportunities:
- Free trading apps
- Over 8,000 signals for copying
- Economic news for exploring financial markets
Registration
Log in
You agree to website policy and terms of use
If you do not have an account, please register
I just clearly saw)))))), 90% we are on top of the upward movement from 1.29. Maximum we will see 1.3690, that will be 100% top)))))))
The next level is 1.3689. Let's look at things realistically: the trend is still upward, the level of 1.3572 is broken through, the next levels are 1.3689, 1.3960. On the H4 the ascending wedge and the wolfs from H1 to D are drawn with the targets 1.3330 and 1.3054, the price is floundering around 1.3620, levels down from that figure are 1.32 and 1.2890. If the correction does not start on Monday, for which there are reasons, the growth will continue till the 10th of February with small pullbacks. That's it.
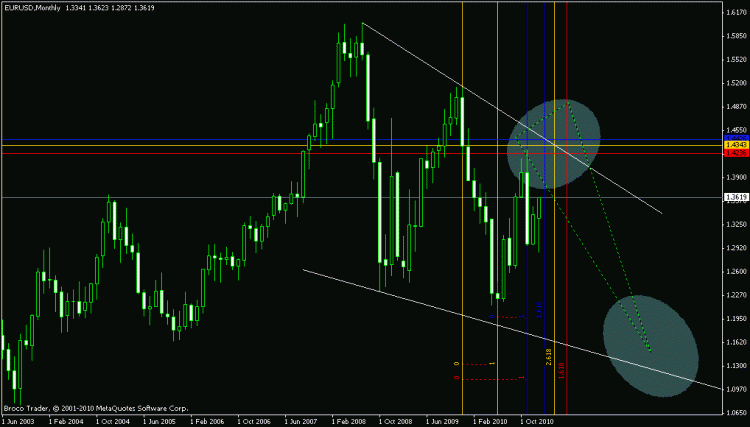
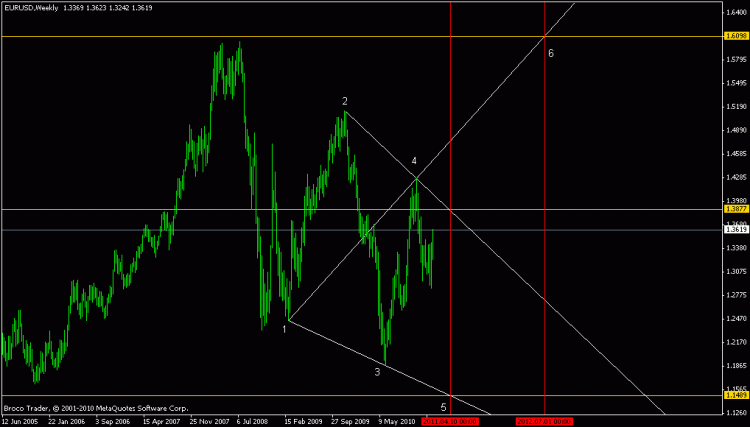
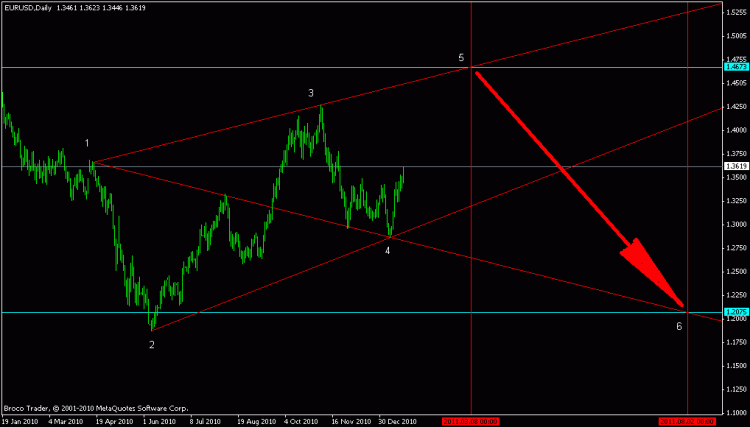
Hello, everyone! These are the pictures I got:


I invite discussion.
strangerr ,Defeat325 20.01.2011 00:41 posted the pictures with your induco (vertik. turn lin.), can you give it a try, thanks?Hello, everyone! These are the pictures I got:
I invite discussion.
Strangerr ,Defeat325 20.01.2011 00:41 posted the pictures with your indicator (vertical pivot line), can you give it a try, thank you?The lines I'm showing you are not an indicator, you can indicate a significant level at D (minimum or maximum), the price and the time and indicate the period lines in the settings to display on the chart. But it would be nice to understand why they draw them. According to my estimations, there are two levels in the nearest future: 23.01.2011 and 10.02.2011.
Those lines that I'm talking about are not an indicator, but an indicator can, you specify a significant level on D (minimum or maximum), price and time, and in the settings you specify the lines of what periods to display on the chart. But it would be nice to understand why they draw them. According to my estimations, in the near future there are two levels: 23.01.2011 and 10.02.2011.
Thank you
Those lines that I'm talking about are not an indicator, but an indicator can, you specify a significant level on D (minimum or maximum), price and time, and in the settings you specify the lines of what periods to display on the chart. But it would be nice to understand why they draw them. According to my estimations, in the near future there are two levels: 23.01.2011 and 10.02.2011.
so will you give an indicator?
What did I post?
I think I figured it out with time, it counts by Fibo, but there are some levels in it, I need to pick them up (the code does not open). I put it on the chart with D, its lines are white. I have not got it with price yet, it should probably be used on lower TFs?
It does not calculate by Fibo. By how much the price does not reach point 5, then by the same amount it usually does not reach target 6.
Here are the levels, the most significant red ones.
Chepkids, how are you?