Hi all...
I have a question about the Fourier transform...
After Fourier transform and high pass filtering with reverse transform,
I need to continue calculating the resulting function outside the range of the transform (if you can give an example)...
Nothing further needs to be calculated, as the Fourier transform is only effectively applied to periodic functions.
Suppose we have a periodic signal on the range obtained,
the consequence is that the beginning of the array is a continuation of the periodic sequence... Right?
Suppose we have a periodic signal on the range obtained,
the consequence is that the beginning of the array is a continuation of the periodic sequence... >> right?
What kind of array?
The Fourier transform is performed on the approximated period from 0 to 2 * PI.
2*PI is 0 degrees for the next period for which the approximation has already been performed on the previous period.
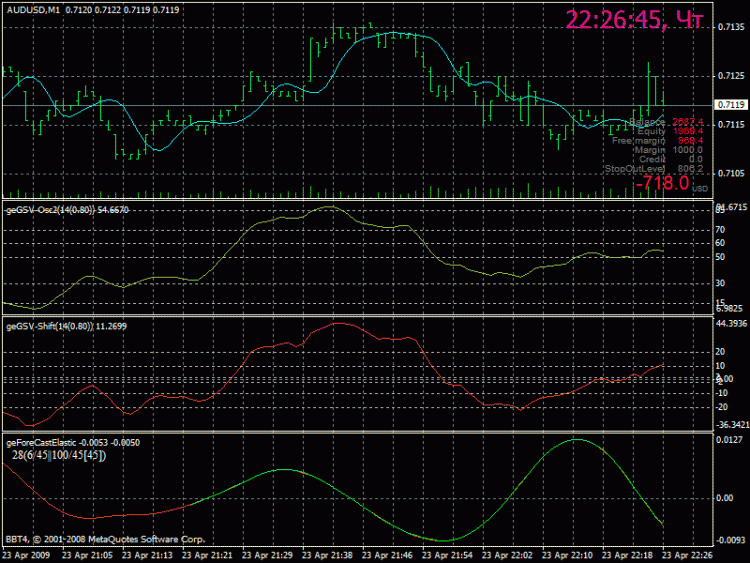
Then let's look at the figure...
The curve (red) in the lower display is the green line obtained in the conversion process with the following parameters
the size of the conversion window 2^6=64 points, the number of frequencies used is 45.
i.e. we get a semblance of the resulting curve ... which was superimposed on the original ...
as you can see from the figure, substituting the beginning for the end is not a real result -
So the question is how to continue the curve as shown by the green line...
....
So the question is how to continue the motion of the curve shown by the green line...
That's the trick with Fourier and similar transformations!
You first bring the non-stationarity of the market into a quasi-stationary form, at least...
Then you can turn everything into stationary sine waves and continue wherever you want. But... You probably won't get anywhere...
Maybe we should put the question in a different way then...
In what way can the function shown in the figure be approximated so that the curve can be continued in a small section?
Maybe we should put the question in a different way then...
What is the best way to approximate the function shown in the figure so that the curve can be continued in a small area?
In a small area any approximation method can be used, using it to extrapolate.
I use the Lagrangian.
Then let's look at the figure...
The curve (red) in the lower display is the green line obtained in the conversion process with the following parameters
the size of the conversion window 2^6=64 points, the number of frequencies used is 45.
i.e. we get a semblance of the resulting curve ... which we imposed on the original ...
as you can see from the figure, substituting the beginning for the end is not a real result -
So the question is how to continue the movement of the curve shown by the green line...
1. Why on earth did you decide that the 64 points taken for approximation are a periodic function?
2. Number of harmonics cannot exceed half of taken samples, i.e. if approximation by 64 divisions of period, maximal harmonic will be 31st
3. unrealistic result because you took a non-periodic function for approximation and therefore period continuation will not match. You have already been told that PF is effective only on periodic functions, everything else is a tambourine game.
You should take two identical periods: 0 - 2*PI, 2*PI - 4*PI. Use both of them to generate PF and compare if there is a match in amplitudes and phases of harmonics. If not, it means that the function is non-periodic and the sampling period should be either increased or decreased (decrease or increase - this is to look at the phase shifts for individual harmonics)
All the rest is just dancing with tambourine.
It is necessary to take two identical periods: 0 - 2*PI, 2*PI - 4*PI. For both of them, it is necessary to bend PF and compare if there is a match in amplitudes and phases of harmonics. If no, then it means that the function is non-periodic and the sampling period must be either increased or decreased (decrease or increase depends on the phase shifts of the individual harmonics)
In principle, this is also "tambourine dancing", only with more "contrivance". The result will be a "prettier" story - nothing more.
Periodic is a function for which there exists T such that for any x the following equality f(x) = f(x+T) is true. Then T is the period of the function f(x).
Simply put - the trader has no guarantee that when T is chosen according to the suggested algorithm (as a common multiple of two consecutive periods), the third period of the same sample size will correspond to the selected value (and the third is just the period, for which extrapolation is done). There is no guarantee with any algorithm for selecting T.
And by the way - if function is periodic - why do we need this Fourier? Has nobody ever thought about it? Find a period and just substitute values, that's all ;). That is, of course, if you found the period and didn't dance with tambourine....
>> Good luck with that.
- Free trading apps
- Over 8,000 signals for copying
- Economic news for exploring financial markets
You agree to website policy and terms of use

Hi all...
I have a question about the Fourier transform...
After Fourier transform and high pass filtering with reverse transform,
you want to continue calculating the resulting function outside the range of the transform (if you can give an example)...