Indicators: Stochastic Oscillator Blau_TS_Stochastic
How to Trade with Stochastic Oscillator (based on dailyfx.com article)
- Slow Stochastic provides clear signals in a forex strategy
- Take only those signals from overbought or oversold levels
- Filter forex signals so you are taking only those in the direction of the trend
Stochastic is a simple momentum oscillator developed by George C. Lane in the late 1950’s. Being a momentum oscillator, Stochastic can help determine when a currency pair is overbought or oversold. Since the oscillator is over 50 years old, it has stood the test of time, which is a large reason why many traders use it to this day.
Though there are multiple variations of Stochastic, today we’ll focus solely on Slow Stochastic.
Slow stochastic is found at the bottom of your chart and is made up of two moving averages. These moving averages are bound between 0 and 100. The blue line is the %K line and the red line is the %D line. Since %D is a moving average of %K, the red line will also lag or trail the blue line.
Traders are constantly looking for ways to catch new trends that are developing. Therefore, momentum oscillators can provide clues when the market’s momentum is slowing down, which often precedes a shift in trend. As a result, a trader using stochastic can see these shifts in trend on their chart.
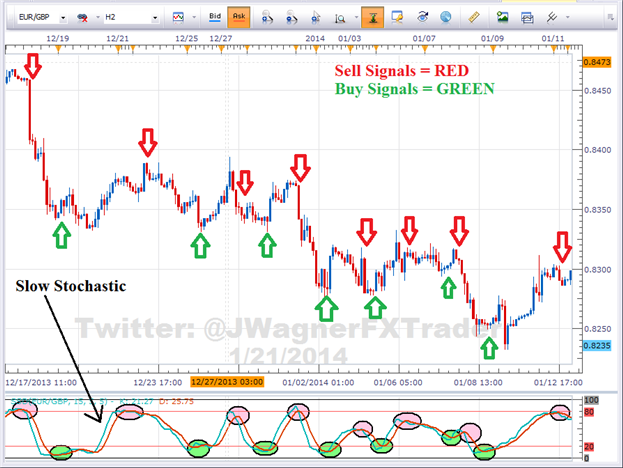
Momentum shifts directions when these two Stochastic lines cross. Therefore, a trader takes a signal in the direction of the cross when the blue line crosses the red line.
As you can see from the picture above, the short term trends were detected by Stochastic. However, traders are always looking for ways to improve signals so they can be strengthened. There are two ways we can filter these trades to improve the strength of signal.
1 - Look for Crossovers at Extreme Levels
Naturally, a trader won’t want to take every signal that appears. Some signals are stronger than others. The first filter we can apply to the oscillator is taking cross overs that occur at extreme levels.
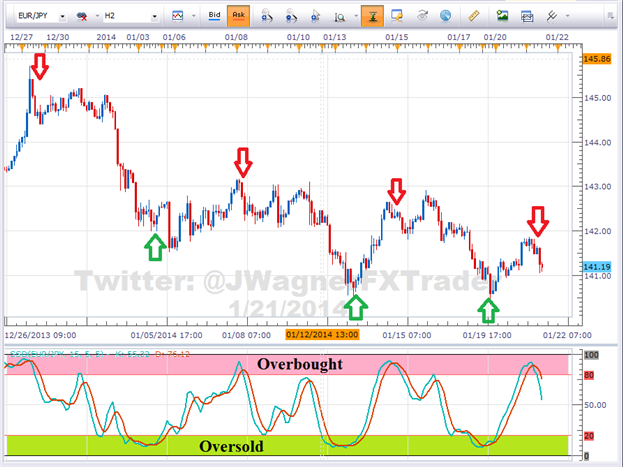
Since the oscillator is bound between 0 and 100, overbought is considered above the 80 level. On the other hand, oversold is considered below the 20 level. Therefore, cross downs that occur above 80 would indicate a potential shifting trend lower from overbought levels.
Likewise, a cross up that occurs below 20 would indicate a potential shifting trend higher from oversold levels.
2 - Filter Trades on Higher Time Frame in Trend’s Direction
The second filter we can look to add is a trend filter. If we find a very strong uptrend, the Stochastic oscillator is likely to remain in overbought levels for an extended period of time giving many false sell signals.
We would not want to sell a strong uptrend since more pips are available in the direction of the trend.
Therefore, if we find a strong uptrend, we need to look for a dip or correction to time a buy entry. That means waiting for an intraday chart to correct and show oversold readings.
At that point, if Stochastic crosses up from oversold levels, then the selling pressure and momentum is likely alleviated. This provides us a signal to buy which is in alignment with the larger trend.
Forum on trading, automated trading systems and testing trading strategies
Indicators: Stochastic Oscillator
newdigital, 2013.10.09 07:23
Pinpointing Forex Trend Trade Entries with Stochastics
- An uptrend is made up of higher highs and higher lows. Traders can use Stochastics to find excellent risk to reward entries at those low support points in the trend.
- A downtrend is made up of lower highs and lower lows. Forex traders can use Stochastics to find excellent risk to reward entries at these resistance high points
- Stochastics can be used to alert a forex trader to either tighten stops, reduce the position size, or take profit once in a trend trade
By far, traders who trade in the direction of the predominant daily trend have a higher percentage of success than those who trade the counter trend. One of the biggest attractions of the Forex market it is characterized by long trends that afford traders the potential to make hundreds of pips if they have timed their entries with precision and used protective stops to limit risk.
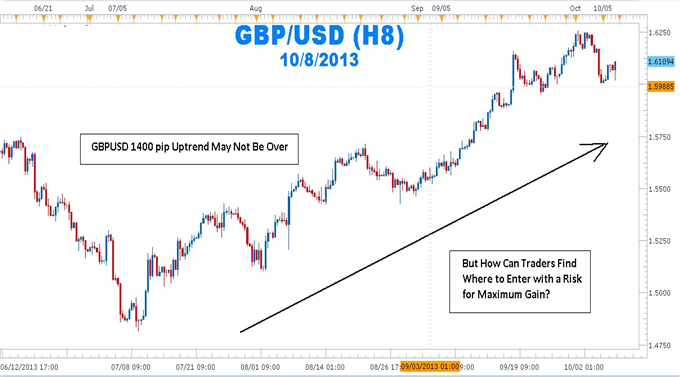
But How Can Traders Find Where to Enter with a Risk for Maximum Gain?
The mantra, “the trend is your friend until it ends,” can be found in many trading books, but it seems that many forex traders have not made the trend their friend and in some cases, the trend has become the enemy. Rather than being on the receiving end of those pips afforded to traders who have correctly entered the trend, many traders have been on the “giving” end of the trade losing pips while fighting the trend.
As people have turned to online dating services to meet their ideal match, forex traders can turn to stochastics as a way of making the trend the their friend again.
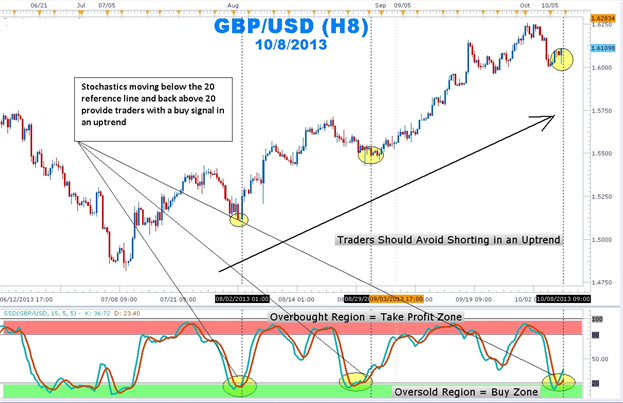
In an uptrend on a daily chart, stochastics %K and %D lines moving below the horizontal ‘20’ reference line and coming back above the 20 line indicates that the profit-taking correction is coming to an end. The stochastic crossing up also tells us that buyers are beginning to enter the market again. In addition, this shows that there is good support.
How to Trade the Trend Using Stochastics
Patience is the name of the game when attempting to trade with the trend. Getting into the trend too early can expose traders to large drawdowns. Getting in too late reduces the amount of profit before the swing is completed.
Use the stochastics indicator to find that “Goldilocks” entry of not too early and not too late. Once a strong uptrend is found, wait for stochastics with the settings of 15, 5, 5 to move into the oversold region below the 20 horizontal reference line. Next, wait for the %K and %D lines to move back above the 20 line. Enter long with a stop placed a few pips below the last low. Set a limit for at least twice the size of the stop.
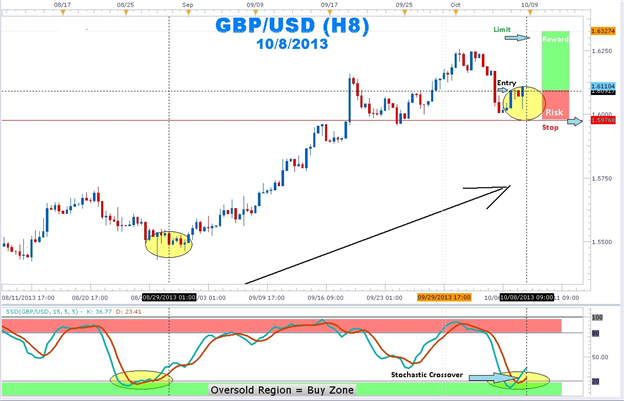
Once in an uptrend position, traders will attempt to squeeze as much profit as possible. Traders usually take profits on their open position or trail stops once stochastics moves into the overbought region. It is important to note that a forex currency pair can continue to make new highs even though stochastics is in the overbought region.
So next time you see a trend and you do not know how to make it your “friend”, let the stochastics indicator introduce you! Once these swings are highlighted by stochastics, stop placement becomes easier as well. stochastics crossovers in an uptrend can help you pinpoint your entries to join the major trend.
Forum on trading, automated trading systems and testing trading strategies
Something Interesting to Read April 2014
newdigital, 2014.04.14 20:48
Theory Of Stochastic Processes : With Applications to Financial Mathematics and Risk Theory
This book is a collection of exercises covering all the main topics in the modern theory of stochastic processes and its applications, including finance, actuarial mathematics, queuing theory, and risk theory.
The aim of this book is to provide the reader with the theoretical and practical material necessary for deeper understanding of the main topics in the theory of stochastic processes and its related fields.
The book is divided into chapters according to the various topics. Each chapter contains problems, hints, solutions, as well as a self-contained theoretical part which gives all the necessary material for solving the problems. References to the literature are also given.
The exercises have various levels of complexity and vary from simple ones, useful for students studying basic notions and technique, to very advanced ones that reveal some important theoretical facts and constructions.
This book is one of the largest collections of problems in the theory of stochastic processes and its applications. The problems in this book can be useful for undergraduate and graduate students, as well as for specialists in the theory of stochastic processes.
- Free trading apps
- Over 8,000 signals for copying
- Economic news for exploring financial markets
You agree to website policy and terms of use
Stochastic Oscillator Blau_TS_Stochastic:
Stochastic Oscillator is based on Stochastic Index by William Blau (see Momentum, Direction, and Divergence: Applying the Latest Momentum Indicators for Technical Analysis).
Author: Andrey N. Bolkonsky