Market etiquette or good manners in a minefield - page 102
You are missing trading opportunities:
- Free trading apps
- Over 8,000 signals for copying
- Economic news for exploring financial markets
Registration
Log in
You agree to website policy and terms of use
If you do not have an account, please register
Now about its usefulness (relevance). By construction, it's always an alternating series. What do you propose to look for in its patterns, the ratio of Kagi zigzag sides?
The patterns themselves as well, since.
The RT is a derivative of the construction kaga, the RT itself is just a number N - 1 on each N-long kaga segment, am I understanding this correctly?
If yes, then PT should also be alternating.
If no, then explain how it is possible to obtain multiple PTs of the same sign in one cagi segment.
To be precise, Pastukhov treats kagi patterns
and Table 3.1 talks about kagi patterns
I propose to use the primary data, the kagi patterns, and build PTs based on their properties.
So I think it's important to:
The RT is a derivative of the construction cagi, the RT itself is just a number N - 1 on each N-long cagi segment, am I understanding this correctly?
Yes, this is correct.
If yes, then the RT should also be sign-variable. If not, explain how it is possible to get multiple RTs of the same sign on the same kagi segment if the kagi construction is correct?
No, this is not a correct statement. It is sufficient to perform the necessary constructions once to be convinced of this:
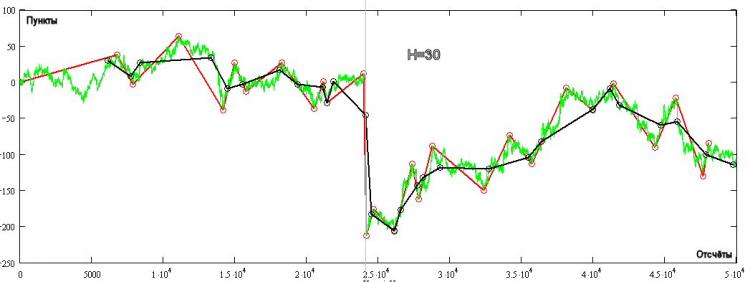
In the fig. the green one shows the tick quotire, the red one is the Kagi construction (always sign-variable) for H=30 pips, and the black one is the PT. There are quite a few areas where PT is not sign-variable! How this happens is seen from the very plot - the next TP reading is obtained when the price moves away from the top by more or equal to H. The TP does not change depending on which strategy you follow (H+ or H-), it only depends on the direction of the position opened at each TP reading.
I propose to use primary data - cagi patterns, and build PTs based on their properties.
Therefore I think it is important:
A counter suggestion is to reach agreement on major issues.
For example, try to get consensus on the question of possible cognate PTs, then that for further discussion it is enough to use PTs only, without appealing to the original Kagi pattern. And finally, to agree that it is necessary and sufficient to use the first difference RT series for analysis (even if Pastukhov does not), which noticeably simplifies pattern analysis!
If you, Michael, have a different vision of the approach to this problem, I would be happy to read the results of your research.
A counter suggestion is to reach agreement on the main issues.
For example, to test a consensus on a possible cognate PT, then, that for further discussion we need to use only PT, without appealing to the original Kagi-building. And finally, to agree that it is necessary and sufficient to use the first difference RT series for analysis (even if Pastukhov does not), which noticeably simplifies pattern analysis!
If you, Michael, have a different vision of the approach to solving this problem, I would be happy to read the results of your research
A difference in the definition of DH is revealed:
Let us understand your definition.
How does it differ from a Renko series?
If nothing, then we are faced with a choice of pattern building method for forecasting between kagi and renko.
On the pages 82-85, Pastukhov evaluates the statistical stability of these two series and comes to the conclusion
It is logical enough to take the more stable ones as predictors.
What are your arguments in favour of choosing renko construction as predictors?
I am talking about Kagi constructions.
The difference between Renko and Kagi according to the thesis, is that for Renko-buildings, the distance between the vertices of the Renko-zigzag is always a multiple of H and is always greater than or equal to H. For Kagi, this distance can be any and is always greater than or equal to H.
Michael, look at the picture above, for Kagi constructions (the ones in red), the segment length can be 3.14H, On the same section, Renko can only be 3H. That's the difference!
And I completely agree with you that there is no competition from Renko and there is no point in considering this breakdown.
I am talking about Kagi constructions.
The difference between Renko and Kagi according to the thesis, is that for Renko-buildings, the distance between the vertices of the Renko-zigzag is always a multiple of H and is always greater than or equal to H. For Kagi, this distance can be any and is always greater than or equal to H.
Michael, look at the picture above, for Kagi constructions (the ones in red), the segment length can be 3.14H, On the same section, Renko can only be 3H. That's the difference!
And I completely agree with you that there is no competition for Renko and there is no point in considering this breakdown.
Let's go again slowly and simply:
Without asking "what is the name of the resulting piecewise monotone PT function?"
Let's ask ourselves the questions:
I have a rough answer to the first question: it is some sort of MA, i.e. some attempt to average a price time series.
I hope you will agree with this.
Then the second question is: why is it better as a predictor than an N-quantized MA?
is a kind of MA, i.e. some attempt at averaging the price time series.
I hope you agree with that.
Yes, I do.
Then the second question is: What is its superiority as a predictor of the same N-quantized MA?
Mashka regardless of hidden patterns of smoothed BP will have a constant FP. If we introduce something similar to FP for RT, an interesting phenomenon is observed, namely, the more BP is different from a Wiener process, the less the FP will have RT. That is, the maximum PT lag is observed on an integrated random process, and, quantitatively, the PT does not exhibit the property of signvariance. However, as soon as the market becomes arbitrageous, the PT exhibits sign-variance properties and its "lag" decreases.
In other words, the "smoothing" effect for the PT is observed only at such H, where the market is arbitrage-free (the average Kagi segment value tends to 2H) and this may serve as a signal to switch to other trade horizons by the parameter H. Or, find the way to exploit this regularity.
Explain to me please, I have been working in finance for I don't know how long and the term transaction has always been used.
And now I look on wikipedia, supposedly in banking it is a transaction. It's very strange, liposuction...
Who can comment?
So go ahead and correct it yourself on this WikiPedia.
I think transaction is more correct, too.
In other words, the "smoothing" effect for PT is observed only on such H, where the market is arbitrage-free (average Kagi segments tend to 2H), and this may serve as a signal to move to other trading horizons by parameter H. Or, find a way to exploit this pattern.
Serge, I will refrain from comparisons with other constructions and approaches for the time being (I need to finish the subject to the end),
maybe we'll get to it later. For now on the subject of kagi:
Since H-volatility depends on the choice of H, two more metrics are needed for a complete kagi analysis.
1) A graph of H-volatility as a function of H. (Horizontal H, vertical H-volatility)
2) A graph of volatility of H-volatility itself. In simple terms - a graph of H-volatility as a function of
time (for fixed H). You cannot do without it. If the curvature is too sharp - there is nothing to catch in these parts.
Why don't you try to make a three dimensional plot (x=t, y=H, z=HVol) ?
2) A volatility graph of H-volatility itself. In simpler terms, a graph of H-volatility as a function of
time (for a fixed H). You can't do without it. If the curvature is too sharp - there is nothing to catch in these parts.
I will try to outline my understanding of the situation.
To evaluate the trading prospects of an instrument you must have a quantitative estimate of predictability
In other words - we work with
for a specific instrument if (and until) there is at least one H-volatility sign for which H-volatility
is predictable at the moment of transaction (tT), which in its turn depends on the selection of Н.
I.e. a two-dimensional table is needed anyway (values in cells are third dimension). Spreading doesn't matter at the moment.
While on the subject of kagi:
Since H-volatility depends on the choice of H, two more metrics are needed for a complete kagi analysis.
1) A graph of H-volatility as a function of H. (Horizontal H, vertical H-volatility)
Here it is:
Below I have attached a file in text format with rows of transactions.
The format of the file is as follows: