You are missing trading opportunities:
- Free trading apps
- Over 8,000 signals for copying
- Economic news for exploring financial markets
Registration
Log in
You agree to website policy and terms of use
If you do not have an account, please register
Good afternoon. Really need help not be able to figure out what to do. If you can help.
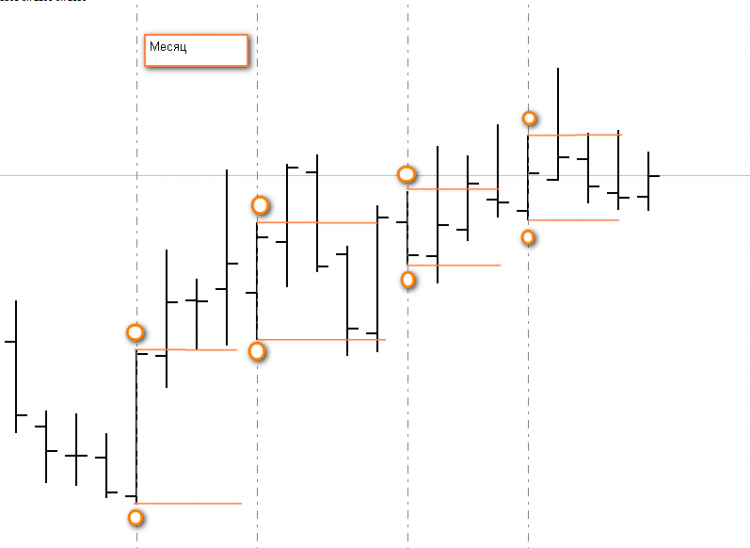
Need an indicator that will mark the first bar of each month. With high and low price lines drawn until the end of the month, with a choice of number of months.
Pr.(Three months. Marking with lines for 3 months ). Or a sample to look at.
Thanks in advance.
Here's a sample script marking the day from the opening + and - 20 pips. Similarly, you can make a definition of the month and respectively high and low of this month.
Here's a sample script marking the day from the opening + and - 20 pips. Similarly, you can make a definition of the month and respectively high and low of this month.
AlexeyVik: Thanks for the feedback.
I don't know if I've stated my flush correctly. I need something like this.
I would be very grateful if you could help, or tell me how to implement it in an indicator.
I am new to programming.
The vertical lines are drawn correctly.
I don't understand how to bind "horizon lines and circles to high and low to the first candle".
Any help would be appreciated.
Read the documentation about CopyRates() function and MqlRates structure. With their help, we can get all the necessary data to implement your wishes.
Then show me what you have and what you cannot achieve. Otherwise, the request to help you read as a request to do it for you. Sorry for being blunt.
Here is the source code. I would appreciate your help in refining it. I need to find the High and Low of each first week of the month.
//+------------------------------------------------------------------+
#property copyright ""
#property link ""
#property indicator_chart_window
//--- Внешние Глобальные переменные
extern int TF = 43200; //--- Через сколько баров рисуются линии (На каком Т/Ф)
extern int barsToProcess = 5; //--- Кол-во отображаемых периодов (линий)
extern string TimeFrames = "M1,5,15,30; 60H1; 240H4; 1440D1; 10080W1; 43200MN."; //--- Подсказка кол-во боров в Т/Ф
//--- Глобальные переменные
string Name_Line; //--- Имя Вертикальных уровней
//double Price_H = High[0]; //--- Макс цены
//double Price_L = Low[0]; //--- Мин цены
//+------------------------------------------------------------------+
int init()
{
//---
return(0);
}
//+------------------------------------------------------------------+
int deinit()
{
int i;
for (i=0; i<Bars; i++) //--- Выбираем все установленные объекты
{
ObjectDelete(Name_Line + DoubleToStr(i,0)); //--- Удаляем все установленные линии
}
return(0);
}
//+------------------------------------------------------------------+
int start()
{
int counted_bars = IndicatorCounted(); //--- перем counted_bars = функц. Возвращает количество баров
int limit; //--- переменная старт кол-во баров. Линии рисуем о по всем барам
int i=0; //--- переменная i = 0 обнуление
if(counted_bars > 0) counted_bars --; //--- последний посчитанный бар будет пересчитан
//--- основной цикл
limit = Bars - counted_bars;
for(i = 0; i < limit; i ++)
{
//+----- Выбираем количество линий отображаемых на экране
if(limit > barsToProcess) //--- Если кол-во линий > Кол-ву отображаемых периодов (линий)
{
limit = barsToProcess; //--- Тогда устанавливаем Кол-во отображаемых периодов (линий)
Name_Line = "Time_VLine M" + TF + " "+DoubleToStr(i,0); //--- И присваиваем имя с соответствующими параметрами
//+------------------------ Рисуем линии -----------------------------------------------------+
while (i<limit) //--- Пока есть линии в окне терминала. Или пока висит индикатор в окне терминала.
{
datetime t_Line = iTime(Symbol(),TF,i); //--- В ПЕРЕМ t_Line Будет Присваиваться значение времени открытия бара
{
ObjectCreate (Name_Line + DoubleToStr(i,0),OBJ_VLINE,0,t_Line,0); //--- Создаём обьект вертикальную линию
ObjectSet (Name_Line + DoubleToStr(i,0),OBJPROP_STYLE,2); //--- Со стилем
ObjectSet (Name_Line + DoubleToStr(i,0),OBJPROP_COLOR,DimGray); //--- Со цветом
ObjectSet (Name_Line + DoubleToStr(i,0),OBJPROP_WIDTH,0); //--- С толщиной
ObjectSet (Name_Line + DoubleToStr(i,0),OBJPROP_BACK,0); //--- С типом отображения. Объект на заднем плане
//+-----------------------------------------------------------------------------+
}
i++;
}
}
}
return(0);
}
In my code, it's not a candle, it's a day. In yours it is a week.
From this we get the time from which to draw the line. You probably need a month. The beginning of the month. But it rarely coincides with the start of the week. So you have to do a little more magic to figure out how to count the first week.
So to say, feel the difference. There is not a great difference in mql4 yet, but who knows what changes may wait for us...
//--- Что здесь не так, при построении линии по лоу. На графике её нет. И Ошибки компиляции тоже нет?
//--- НО по отдельности всё работает.
Note the names of trend lines.
//----- Для чего нужен этот блок если линия отрисовывается на графике и без него
I have 3 lines. That is why I have 3 functions and 3 names of lines.
Then the answer to only one question
//--- Что здесь не так, при построении линии по лоу. На графике её нет. И Ошибки компиляции тоже нет?
//--- НО по отдельности всё работает.You have the same line name here, and it should be different.
Why did you delete and correct your messages?
You didn't reply for a long time, I thought you weren't answering stupid questions, so I deleted them.