Hearst index - page 20
You are missing trading opportunities:
- Free trading apps
- Over 8,000 signals for copying
- Economic news for exploring financial markets
Registration
Log in
You agree to website policy and terms of use
If you do not have an account, please register
There's also the option of permanently dividing the segment in half.
Hm, and the points for which the difference Close[i+1]-Close[i] = 0 and the standard deviation 0, are simply not considered when constructing a straight line?
There is also an opinion that one should use the so-called RANSAC( http://en.wikipedia.org/wiki/RANSAC ) instead of the usual ISC to calculate the Hurst coefficient because the points "out of the total number", i.e. the most distant from the total mass, may influence the slope coefficient of the straight line with the usual ISC.
понял. Я брал среднее геометрическое из High и Low. Сейчас посмотрю что будет на разнице. Я пока не могу решить что целесообразнее - брать код для MT4 и переделывать под Си или искать ошибки у себя ;) У меня данные это дневные бары(5ти минутки), всего их 78. Я точки стоил по значениям для 3,4...78и. - МТ4 моментально обсчитает 78 баров, даже до десятка тысяч считает быстро. А вот для каждого бара расчитывать Херста на многотысячной выборке - это уже долго, если баров тоже тыщи.
Есть еще вроде вариант постоянного деления отрезка пополам. - не совсем представляю о чем вы, но если длина выборки - степень двойки, то да, работает. В любом случае предпочтительнее иметь выборку с длиной имеющей как можно больше делителей.
Хм, а точки для которых разница Close[i+1]-Close[i] = 0 и среднеквадратичное отклонение 0, просто не рассматриваются при построении прямой? - (Close[i+1]-Close[i]) - это входные данные, прямая строится не по ним, а по коэффициентам, которые получаются из этих данных при R/S анализе.
Еще есть мнение что подсчета коэффициента Херста нужно использовать не обычный МНК, а т.н. RANSAC( http://en.wikipedia.org/wiki/RANSAC ), т.к. при обычном МНК на коэффициент наклона прямой могут влиять точки, "выбивающиеся из общего числа", т.е. наиболее удаленные от общей массы. - Не представляю на основании какой модели, можно решить, что некоторые возвраты подлежат выбросу из выборки?
(Close[i+1]-Close[i]) = 0 => log(d[i]/d[i-1]) = INF - I don't understand what to do with this. RS = R/S - and how to calculate when S = 0, assume that R = 0 too? then again log(R) = INF and again I don't understand what to do. Ok. Here's a simple example - what is the coefficient H
and if (Close[i+1]-Close[i]) = const for all i on a given interval?
I have no idea on the basis of which model, it can be decided that some returns are to be discarded from the sample? -If, for example, there was an error in several values in the stock data stream (54.5 instead of 14.4)
function RS takes as input an array of Close[i]-Close[i-1] and the number of elements of the array
1. S[i-1] = Close[i]-Close[i-1] For all i from 0 to N
2. h[i] = log(S[i]/S[i-1])
3. hn = Sum of h[i] h_cp = arith. Hn
4. R = max(h[i] - h_cp) - min( h[i] - h_cp ) S = 1/n * (h[i] - h_cp) RS = R / S
5. Then I stand m-n points with value of log RS(i) and log i for i from n_min to some N and MNCs stand a straight line
В общем давайте я расскажу свой алгоритм обсчета словами, а вы мне скажете пж где ошибка, а то мы так долго друг друга чуствую не поймем.
функция RS на вход принимает массив из Close[i]-Close[i-1] и число элементов массива
1. S[i-1] = Close[i]-Close[i-1] Для всех i от 0 до N
2. h[i] = log(S[i]/S[i-1]) - не стоит так делать, т.к. п.1 и п.2 в принципе одно и тоже в смысле подготовки данных для алгоритма. Действительно, вместо возвратов на вход можно подавать log(Close[i]/Close[i-1]), но подавать на вход логарифм отношения возвратов - это перебор, по-моему. Достаточно подавать что-нибудь одно - либо разницу цен, либо логарифм их отношений.
3. Hn = Сумма h[i] h_cp = ср.ариф. Hn
4. R = max(h[i] - h_cp) - min( h[i] - h_cp ) S = 1/n * (h[i] - h_cp) RS = R / S
5. Далее стою м-во точек со значением log RS(i) и log i для i от n_min до некоторого N и МНК стоют прямую
в п.3-5 для начала не вижу оператора или описания, что вся выборка делится на N кусков размером M, что для каждого этого куска считается rs = (максимум наращиваемой суммы отклонений от среднего - минимум наращиваемой суммы отклонений от среднего) / сумму квадратов отклонений от среднего, и все они, эти rs, складываются, а потом делятся на N. Теперь Log(RS) и log(N) - это одна точка для МНК, которых надо насобирать побольше, подбирая разные N и М так, чтобы N*M=длина выборки всегда. На мой взгляд, запись п.4 полностью неверна.
As I understand it makes no sense to calculate the coefficient for 78 values - i.e. for one-day bar? I also still do not understand what to do if some values are equal to zero. For example if I input price difference, it is clear that the difference in 5 minutes may be less or equal to 0, but then log is not taken. I have an idea to take the modulus of the value in case it is negative (i.e. absolute difference) and in case of 0 do not enter this value into series h.
The test file itself. H~0.72
Your indicator zHursttExponent.mq4 shows 0.1647 on your test file brown72.txt. What is this about?
As far as I understood, this indicator calculates the Hurst value for each tick for the last 2520 bars and prints it out. Is it so ?
What do 4 bins of this indicator mean then and what for are they needed in a separate window?
And one more question.
for(int i=0; i<limit; i++)
{
}
//---- done
What is the meaning of this piece in the code of the indicator ?
Ваш индикатор zHursttExponent.mq4 на вашем же тестовом файле brown72.txt выдает 0.1647. К чему бы это ?
Насколько я понял, этот индикатор считает показатель Херста на каждом тике для последних 2520 баров и выдает значение на печать. Так ?
А что тогда означают 4 буфера этого индикатора и зачем они нужны в отдельном окне ?
И еще один вопрос.
for(int i=0; i<limit; i++)
{
}
//---- done
Какой смысл имеет этот кусок в коде индикатора ?
1. Can't repeat your result = 0.1647. Mine is like this (=0.7241):
2) Yes, this indicator considers the Hurst index on every tick for the last 2520 bars and prints the value and draws r/s points (white line), on which the approximation straight line (red line) is drawn, the slope of which is the sought index - for clarity, but for me - for a qualitative visual estimation of the algorithm correctness. All this is true when cRSGraphic = true, otherwise the indicator considers the Hurst index for the last 250 bars.
3. 4 buffers is an apparent redundancy, a relic left over from the time of debugging and testing.
4. Empty loop - the same problem as in item 3.
Подниму ка тему) Спасибо Vita - написал win32api под c++ и все пашет как надо. Вопрос к людям которые часто применяли этот метод - есть какие-нибудь оценки погрешностей от числа входящих данных, дисперсии, корреляции и мб других стат.величин.
Как я понял вообще смысла особого нет считать коэффициент для 78 величин - т.е для однодневного бара? Так же по прежнему не понимаю что делать если какие-то величины равны нулю. Ну например если на вход подаю разность цен - понятное дело что разность за 5ть минут мб меньше или равны 0, но log тогда не берется. У меня есть идея брать модуль величины в случае если она отрицательна(т.е абсолютную разницу) а в случае 0 не заносить это значение в ряд h.
Here's a variant in which the error is counted. Unfortunately, I can't find where I stole the C source of this wonder, but it claims to count by Feder E. Fractals. For him Test H=0.6807 for the same file. Seems like it's not bad.
For 78 values it's the hardest. A lot of work is devoted to how to estimate Hurst on half a hundred observations. Even without understanding the calculations, you get very different results from one author to another. There's nothing surprising about that. As many algorithms as there are indicators :). Oh, and another problem - in attached version on 1000 observations with error taken into account we can't say anything about the price - is it consistent or not at the moment, because 0.5 lies just between error channel (red lines at cRSGraphic=false).
The input should be either the price difference or the logarithm of the price ratio.
1. Can't repeat your result = 0.1647. Mine is like this (=0.7241):
You have attached the file brown72.txt. However, your indicator tests on the file brown72.csv. For lack of other instructions I just renamed it and put it in the \experts\files folder. Here's the result:
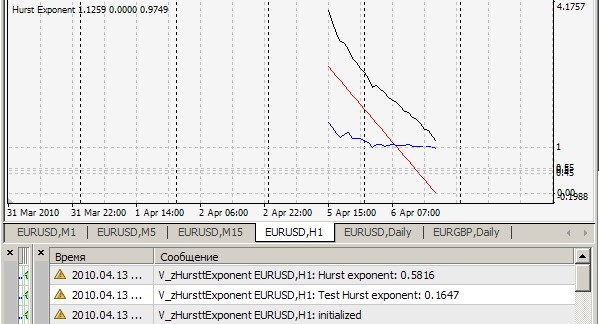
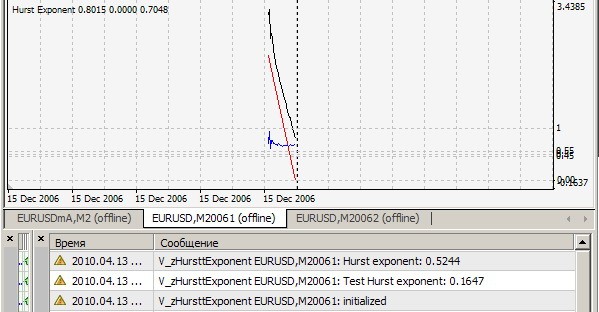
On H1:
On ticks:
Your file contains 1024 values. Here are the first 4 of them:
45.47422
42.55601
46.5188
41.61502