I will write the indicator for free - page 65
You are missing trading opportunities:
- Free trading apps
- Over 8,000 signals for copying
- Economic news for exploring financial markets
Registration
Log in
You agree to website policy and terms of use
If you do not have an account, please register
Alexander, pleasewrite an indicator for me.
Have you tried to draw it yourself? What to do, for example, with single colour changes - the length of one candle?
You must understand that you can do lots and lots of things, but sometimes you have to see the sense to do something, if you can watch a colour change, then why should I draw a zigzag on a colour change?
As you may notice, the zigzag candlestick is re-drawn and you won't be able to use it there because it may constantly change during the flat.Have you tried to do it yourself? What to do with single colour changes - the length of one candle?
You should understand that you can do any and many things, but sometimes you need to see the sense to do something, if you can watch a colour change, then why should I zigzag on colour change
Moreover, you have to take into account that the zero candle is re-drawn and you cannot use colour change there, because it may constantly change during the flat.I have not tried to draw it, honestly, I do it by eye.
I'm working for minutes, I get tired quickly, my eye gets tired, I start making silly mistakes... It may be easier with zigzag ...
Before every(!) change of colour, even if it's a single candle, there is a fractal, not always in the usual sense, sometimes it's just a squiggly, bigger or smaller, but has a max.min.
If you want a wave.
As far as I know the bar does not redraw after the end of the candle.
Help with indicator, need to add some features to the indicator and add MA, description in document :
indicators :
Help with indicator, need to add some features to the indicator and add MA, description in document :
indicators :
Where did the links go?
No third-party links allowed.
Post the open source code and description in the thread. Maybe someone will respond and post a ready solution here too.
Help with the indicator, need to add some features to the indicator and add MA, description :
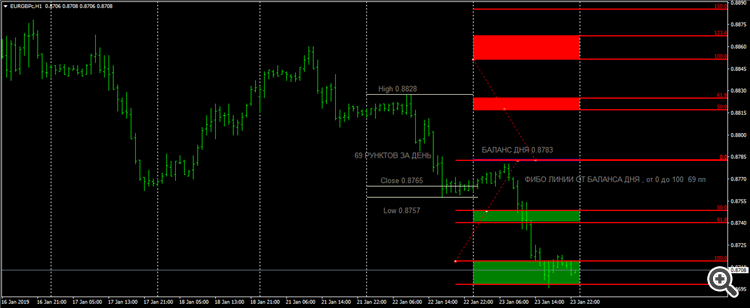
Hello . Can you write such an indicator? The indicator should build a balance line - Day, Week, Month, Year.
Conditions for drawing - High + Low + Close(Day) / 3 = Balance of Day.
The same for Weeks, Months and Years.
And also it should build 2 zones above the balance line and 2 zones below the balance line.
Condition of construction of zones - based on the Fibo line, the number of points traversed during the previous day 0 on the balance of the day, down - up 100 points on the number of points traversed during the previous day. The first zone is between 50 and 61.8 Second zone is between 100 -123.6 I made an example, the photo should be more clear. If possible, it would be possible to switch on/off day, week, month, year. Number of days , weeks , months , displayed on the history . It is possible to change the colour of zones, Balance lines, depending on the day, week, month. Fibo lines themselves are not shown on the chart. Only zones and the Balance Sheet .
.