Bayesian regression - Has anyone made an EA using this algorithm? - page 40
You are missing trading opportunities:
- Free trading apps
- Over 8,000 signals for copying
- Economic news for exploring financial markets
Registration
Log in
You agree to website policy and terms of use
If you do not have an account, please register
And my soul keeps wanting to dig into the subject of supposedly normally distributed incremental quotes.
If someone is in favour, I will give arguments why this process cannot be normal. And these arguments will be understandable to everyone, while being consistent with the CPT. And these arguments are so trivial that there should be no doubt.
And what will probability express, the forecast for the next bar, or the motion vector of the next bars?
Probability will express the forecast of the next tick ( increment). I just want to:
- calculate the values of future Ybayes ticks for which the probability by Bayes formula will be maximum.
- Compare Ybayes to the actual Yreal ticks coming in . Collect and process the statistics .
If the difference in values is within a reasonable range then I will post the code and ask what to do next. Regression? Vector? Scalping?
The probability will express the prediction of the next tick ( increment). I just want to:
Why go down to ticks? You can learn to predict tick directions in 5 minutes with 70% accuracy, but 100 ticks ahead, you know the accuracy will drop.
Try increments half an hour or an hour ahead. It's interesting to me too, maybe I can help in some way.
The probability will express the prediction of the next tick ( increment). I just want to:
- calculate the values of future Ybayes ticks for which the probability by Bayes formula will be maximal.
- Compare Ybayes to the actual Yreal ticks coming in . Collect and process the statistics .
If the difference in values is within a reasonable range, I'll post the code and ask what to do next. Regression? Vector? Curve? Scalping?
What's wrong with ARIMA? In packages the number of diffs (increments of increments) is calculated automatically depending on the input stream. Lots of subtleties related to stationarity are hidden inside the package.
If you really want to go that deep, then some ARCH?
I tried it once. The problem is this. The increment can be calculated easily. But if we add the confidence interval of this increment to the increment itself, it will be either BUY or SELL since the previous price value falls inside the confidence interval.
Yes, the classical approach, as SanSanych writes, is data analysis, data requirements, and system errors.
But this thread is about Bayes and I am trying to think in Bayesian terms, like the soldier in the trench calculating the posterior (after experience) probability. I gave an example of the soldier above.
One of the main questions is what to take as a priori probability. In other words, who should we put behind the curtain of the future, to the right of the zero bar? Gauss? Laplace? Wiener? What do professional mathematicians write here (for me a dark "forest")?
I choose Gauss because I have an idea of normal distribution and I believe in it. If it will not "shoot" then it is possible to take other laws and substitute Gauss instead of Bayes formula, or together with Gauss as product of two probabilities. Try to make a Bayesian network, if I understand it correctly.
Naturally, I can't do it alone. I would like to solve the problem with Gauss, which I formulated under the bouquet. If anyone is willing to join me on a voluntary basis, please do so. Here's an actual problem.
Given: МТ4 generator of random numbers.
Need: Write MQL4 code as function FP() converting MT4[] array formed by the standard RNG into ND[] array with normal distribution.
Vasily (I don't know my patronymic) Sokolov showed me the transformation formulas at https://www.mql5.com/go?link=https://habrahabr.ru/post/208684/.
The altruism and kindness will be a graphic representation of the results, though I can zoom the charts of calculated arrays directly in the MT4 window. I was doing it in my projects.
I understand that many people here may solve this problem with a couple of clicks in math packages, but I want to speak in a language MQL4, that is commonly understood by traders, programmers, economists and philosophers.
Yes, the classical approach, as SanSanych writes, is data analysis, data requirements, and system errors.
But this thread is about Bayes and I am trying to think in Bayesian terms, like the soldier in the trench calculating the posterior (after experience) probability. I gave an example of the soldier above.
One of the main questions is what to take as a priori probability. In other words, who should we put behind the curtain of the future, to the right of the zero bar? Gauss? Laplace? Wiener? What do professional mathematicians write here (for me a dark "forest")?
I choose Gauss because I have an idea of normal distribution and I believe in it. If it will not "shoot" then it is possible to take other laws and substitute Gauss instead of Bayes formula, or together with Gauss as product of two probabilities. Try to make a Bayesian network, if I understand it correctly.
Naturally, I can't do it alone. I would like to solve the problem with Gauss, which I formulated under the bouquet. If anyone is willing to join me on a voluntary basis, please do so. Here's an actual problem.
Given: МТ4 generator of random numbers.
Need: Write MQL4 code as function FP() converting MT4[] array formed by the standard RNG into ND[] array with normal distribution.
Vasily (I don't know my patronymic) Sokolov showed me the transformation formulas at https://www.mql5.com/go?link=https://habrahabr.ru/post/208684/.
However I can and I can rescale charts of calculated arrays directly in MT4 window. I was doing it in my projects.
I understand that many traders may solve this problem in a couple of clicks using mathematical packages, but I want to use the MQL4 language, which is generally accessible to traders, programmers, economists and philosophers.
Here is a generator with different distributions, including the normal one:
https://www.mql5.com/ru/articles/273
A brief distribution analysis in R:
# load data fx_data <- read.table('C:/EURUSD_Candlestick_1_h_BID_01.08.2003-31.07.2015.csv' , sep= ',' , header = T , na.strings = 'NULL') fx_dat <- subset(fx_data, Volume > 0) # create open price returns dat_return <- diff(x = fx_dat[, 2], lag = 1) # check summary for the returns summary(dat_return) Min. 1st Qu. Median Mean 3rd Qu. Max. -2.515e-02 -6.800e-04 0.000e+00 -3.400e-07 6.900e-04 6.849e-02 # generate random normal numbers with parameters of original data norm_generated <- rnorm(n = length(dat_return), mean = mean(dat_return), sd = sd(dat_return)) #check summary for generated data summary(norm_generated) Min. 1st Qu. Median Mean 3rd Qu. Max. -8.013e-03 -1.166e-03 -7.379e-06 -7.697e-06 1.152e-03 7.699e-03 # test normality of original data shapiro.test(dat_return[sample(length(dat_return), 4999, replace = F)]) Shapiro-Wilk normality test data: dat_return[sample(length(dat_return), 4999, replace = F)] W = 0.86826, p-value < 2.2e-16 # test normality of generated normal data shapiro.test(norm_generated[sample(length(norm_generated), 4999, replace = F)]) Shapiro-Wilk normality test data: norm_generated[sample(length(norm_generated), 4999, replace = F)] W = 0.99967, p-value = 0.6189We estimated the parameters of the normal distribution from the available clock-bar opening price increments and plotted to compare the frequency and density for the original series and the normal series with the same distributions. As you can see even by eye, the original series of increments of hour bars is far from being normal.
And by the way, we are not in a temple of God. It is not necessary and even harmful to believe.
Here is a curious line from the post above, which echoes what I wrote above
-2.515e-02 -6.800e-04 0.000e+00 -3.400e-076.900e-04 6.849e-02
As far as I understand in quadrants, 50% of all the increments on the o'clock are less than 7 pips! And the more decent increments are in the thick tails, i.e. on the other side of good and evil.
So what will the TS look like? That's the problem, not the Bayesian and other, other, other....
Or should it be understood in some other way?
Here is a curious line from the post above, which echoes what I wrote above
-2.515e-02 -6.800e-04 0.000e+00 -3.400e-076.900e-04 6.849e-02
As far as I understand in quadrants, 50% of all the increments on the hourly are less than 7 pips! And the more decent increments are in the thick tails, i.e. on the other side of good and evil.
So what will the TS look like? That's the problem, not the Bayesian and other, other, other....
Or should it be understood in some other way?
SanSanych, yes!
plot(y = hour1_quantiles$value, x = hour1_quantiles$probability, main = 'Quantile values for EURUSD H1 returns')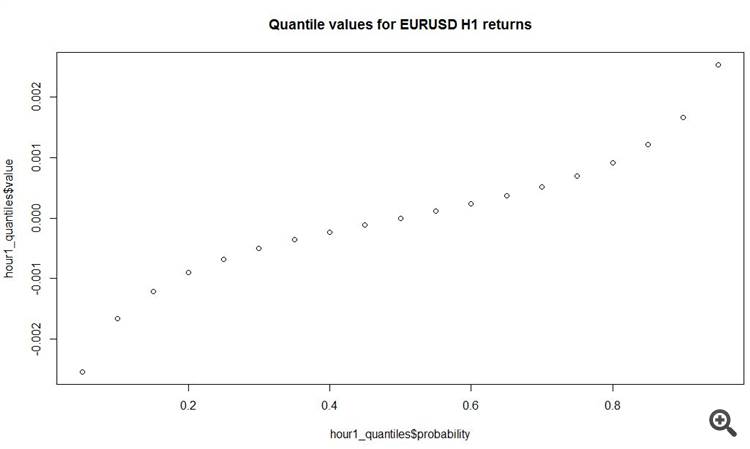
And another interesting thing is that the average absolute increment on hourly bars is 11 pips! Total.
You'll have to make it for a long time, because you need retransformation and... And Box-Cox doesn't really like it)))) It's just a shame that if you don't have
It's just a pity that if you don't have good predictors, it won't have much effect on the end result...