Trading Systems: Layman's Notes: ZigZag…
Thank you for this great work.
Can you help to me to try this? I get this error message from JOURNAL:
"2008.07.29 14:11:28 2007.01.02 08:00 TF EURUSD,H1: SetIndexBuffer function must be called from custom indicator only"
Hi Alexei,
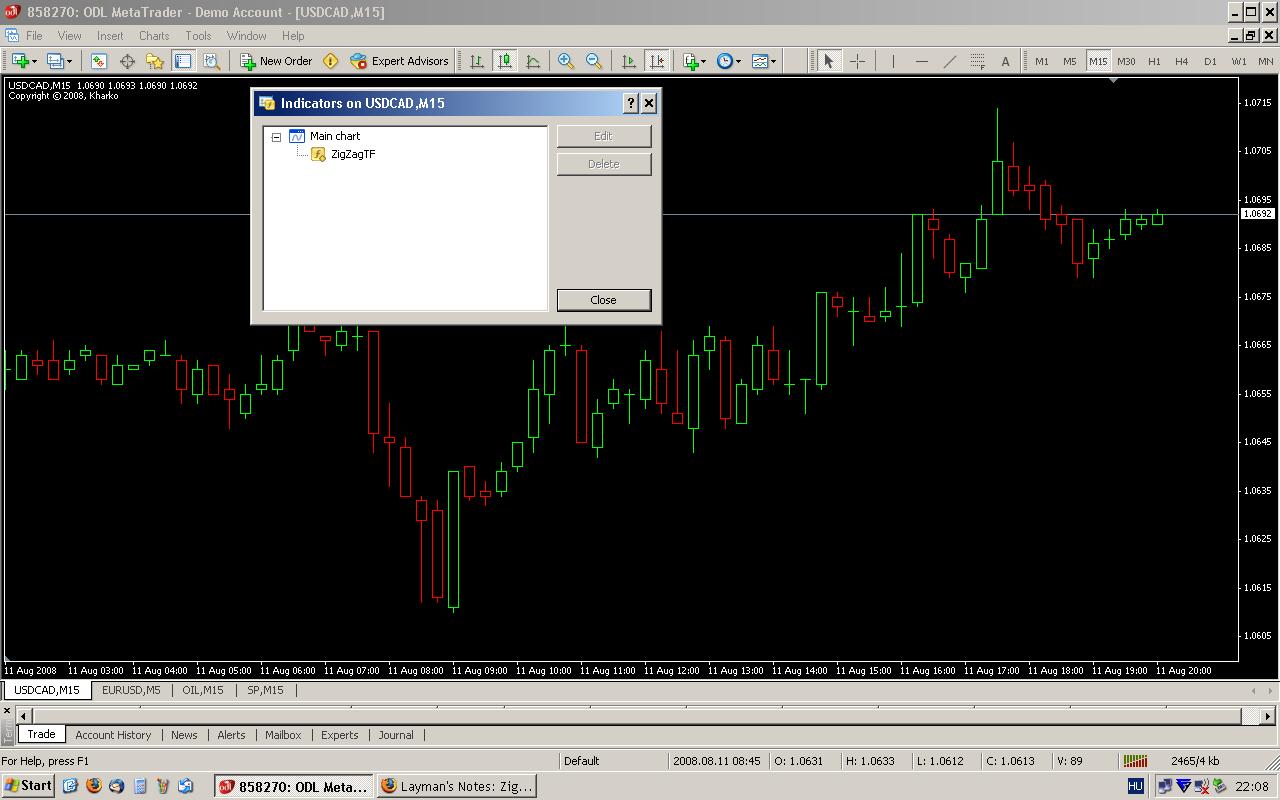
Why can't I see your indicator on my chart?
Great indicator, thanks! ps for those using this the first time, it took a minute or so for the fib1 and fib2
to show up during which time the zig zag line disappeared. Be patient!
Very Interesting, I'm trying to build an ea based on zigzag indicator and I show you the result of backtesting from may 2008 till now.
No bad isn't it?
Very Interesting, I'm trying to build an ea based on zigzag indicator and I show you the result of backtesting from may 2008 till now.
No bad isn't it?
Can you share your EA?
does it repaints like the normal zig zag??
I am trying to read the results of the 4 buffers and then understand what it is, however I am only getting zero in most part of the positions of the output buffers. What am I doing wrong?
How can I get the most recent High and Low?
//+------------------------------------------------------------------+
//|                                                      TesteTF.mq4 |
//|                        Copyright 2018, MetaQuotes Software Corp. |
//|                                             https://www.mql5.com |
//+------------------------------------------------------------------+
#property copyright "Copyright 2018, MetaQuotes Software Corp."
#property link      "https://www.mql5.com"
#property version   "1.00"
#property strict

//indicador
const string indicator_name = "ZigZagTF";
const int ExtDepth = 12;
const int checkbar = 2;
const int timeframe = 0;
const int price = 0;
const color ZZcolor = clrYellow;
const int ZZwidth = 2;
const bool Levels = true;
const bool Record = true;
const bool Lcolor = clrAqua;
const bool Hcolor = clrAqua;
const bool Fibo1 = true;
const bool Fibo2 = true;
const color FiboColor1 = clrAqua;
const color FiboColor2= clrAqua;

//+------------------------------------------------------------------+
//| Expert initialization function                                   |
//+------------------------------------------------------------------+
int OnInit()
  {
//---

//---
   return(INIT_SUCCEEDED);
  }
//+------------------------------------------------------------------+
//| Expert deinitialization function                                 |
//+------------------------------------------------------------------+
void OnDeinit(const int reason)
  {
//---

  }
//+------------------------------------------------------------------+
//| Expert tick function                                             |
//+------------------------------------------------------------------+
void OnTick(){
//---
   if(IsNewCandle()){
   for(int i=0;i<50;i++){
      printf("LowBuffer["+i+"]: "+GetZigZagLowBuffer(i));
      printf("HighBuffer["+i+"]: "+GetZigZagHighBuffer(i));
      printf("LowLevel["+i+"]: "+GetZigZagLowLevel(i));
      printf("HighLevel["+i+"]: "+GetZigZagHighLevel(i));
   }}
}
bool IsNewCandle(){
   //Somente é inicializado uma vez e somente percebido pela função que inicializa
    static int BarsOnChart = 0;
    if(BarsOnChart == Bars) return false;
    BarsOnChart = Bars;
    return true;
}
//+------------------------------------------------------------------+
double GetZigZagLowBuffer(int i){
   double temp = iCustom (Symbol(),PERIOD_CURRENT,indicator_name,
                              //NEXT LINES WILL BE INDCATOR INPUTS
                              ExtDepth,checkbar,timeframe,price,ZZcolor,ZZwidth,Levels,Record,Lcolor,Hcolor,Fibo1,Fibo2,FiboColor1,FiboColor2,
                              0,//Index Buffer
                              i//Shift used is 1 because signals is at Close of bar
                              );
   return temp;
}

double GetZigZagHighBuffer(int i){
   double temp = iCustom (Symbol(),PERIOD_CURRENT,indicator_name,
                              //NEXT LINES WILL BE INDCATOR INPUTS
                              ExtDepth,checkbar,timeframe,price,ZZcolor,ZZwidth,Levels,Record,Lcolor,Hcolor,Fibo1,Fibo2,FiboColor1,FiboColor2,
                              1,//Index Buffer
                              i//Shift used is 1 because signals is at Close of bar
                              );
   return temp;
}

double GetZigZagLowLevel(int i){
   double temp = iCustom (Symbol(),PERIOD_CURRENT,indicator_name,
                              //NEXT LINES WILL BE INDCATOR INPUTS
                              ExtDepth,checkbar,timeframe,price,ZZcolor,ZZwidth,Levels,Record,Lcolor,Hcolor,Fibo1,Fibo2,FiboColor1,FiboColor2,
                              2,//Index Buffer
                              i//Shift used is 1 because signals is at Close of bar
                              );
   return temp;
}

double GetZigZagHighLevel(int i){
   double temp = iCustom (Symbol(),PERIOD_CURRENT,indicator_name,
                              //NEXT LINES WILL BE INDCATOR INPUTS
                              ExtDepth,checkbar,timeframe,price,ZZcolor,ZZwidth,Levels,Record,Lcolor,Hcolor,Fibo1,Fibo2,FiboColor1,FiboColor2,
                              3,//Index Buffer
                              i//Shift used is 1 because signals is at Close of bar
                              );
   return temp;
}
if(MarketInfo(Symbol(),MODE_TRADEALLOWED) != 1){return(1);}
should allow the indicator to be attach to offline charts.
- Free trading apps
- Over 8,000 signals for copying
- Economic news for exploring financial markets
You agree to website policy and terms of use
New article Layman's Notes: ZigZag… has been published:
Surely, a fey thought to trade closely to extremums visited every apprentice trader when he/she saw "enigmatic" polyline for the first time. It's so simple, indeed. Here is the maximum. And there is the minimum. A beautiful picture on the history. And what is in practice? A ray is drawn. It should seem, that is it, the peak! It is time to sell. And now we go down. But hell no! The price is treacherously moving upwards. Haw! It's a trifle, not an indicator. And you throw it out!
Again and again, we come back to the ZigZag indicator after having read some intelligent books about Elliot's wave theory, Fibo levels, Gartley's patterns, etc. An endless circle. An infinite subject to discuss.
The ZigZag indicator is a polyline that consequently joins the peaks and troughs on a price chart. In such a manner, we display the path the price has "followed" with the course of time. This brings up a question now...What are these peaks and troughs?
The article contains the following:
- the description of ZigZag;
- the description of a method to find price models "Peak" and "Trough";
- the definition of potential reverse points;
- the revelation of the indicator's additional features.
Author: Alexei Kharchenko