MT4 backtest drawdown line / graph
When you see that kind of "bell" in the graph. that means there were several open trades that closed altogether on same time. ("basket of trades")
Part of those trades, those that were opened earlier for the longer time had a drawdown for sure.
So why does not MT4 show that drawdown for those trades and sometimes it does?
No green line that goes down to reflect the DD, and there was DD!
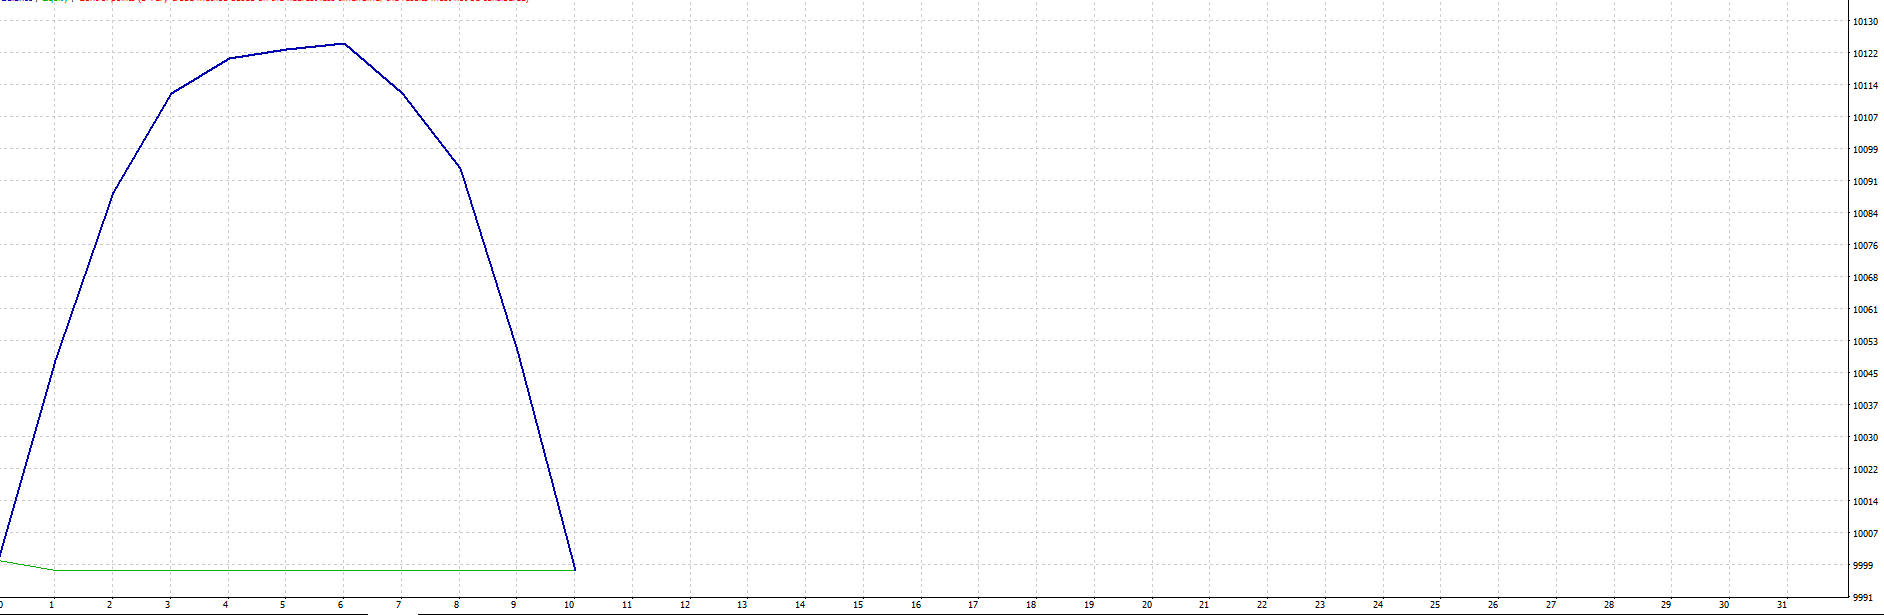
The Blue Line is Balance and the Green Line is Equity.
There was DrawDown, indeed, but the Graph's X-Axis draws from OrderClose to OrderClose. The DD happened "without being printed".
All of you Positions are closed at the same time; so the Equity remains the same through the "close loop".
The DD is not showing because, at the time you closed all positions, your equity was xx$.
Well, I still don't understand this.
Why it does not reflect the DD in the green line on this example, while on other basket trades which behave exactly the same it still reflects the DD.
Can you please explain what is the difference?
- Free trading apps
- Over 8,000 signals for copying
- Economic news for exploring financial markets
You agree to website policy and terms of use
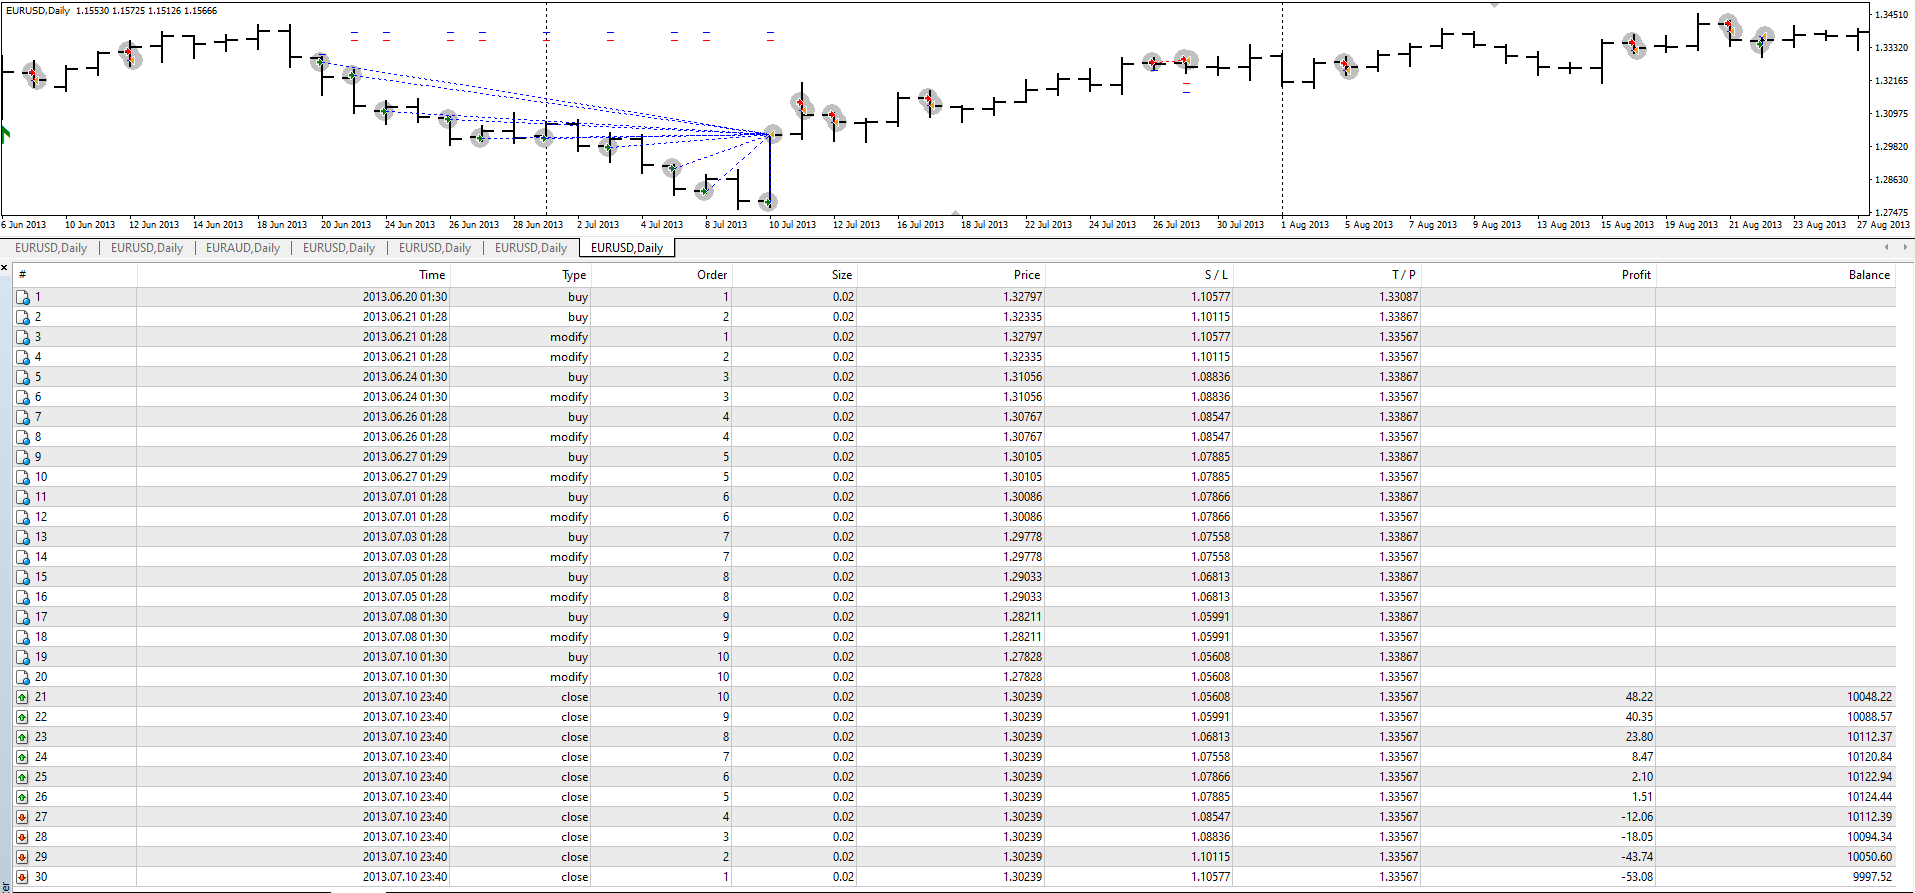
When MT4 backtest is completed, I go to "Graph" tab to review the profit and drawdown curves.
Why is the drawdown shown sometimes as it should be (green line going down and then up, while sometimes there is no drawdown green line while actually there was?
I marked in the picture below the correct drawdown curve with yellow marker, and the "no drawdown" with an X.