How to Create Supply & Demand EA?
There's a lot of things wrong here.
Before I go any further, you're going to have put in work and make progress on your own and read the documentation, then come back and ask for help when you're truly stuck.
With that out of the way, your first goal should be to know how to create a Rectangle object.
The first thing is I see is that you're using the candle that's currently open, which is probably not your intended behavior.
int i=0;
Eventually, you will want to know how to programmatically determine where a Supply/Demand Zone exists and which two price points of the candle(s) you want to use for the Rectangle.
For now, let's just draw a rectangle from the candle on index 20 (the 21st candle starting from the right side of the chart going left).
int i = 20;
From there, grab the information you want from the candle:
double high    = High[i];
double low     = Low[i];
datetime date1 = Time[i];
Now, let's say you want to extend the rectangle to 5 candles passed the currently open candle
datetime date2 = Time[0] + (PeriodSeconds() * 5) // NOTE: in MQL, datetime values are seconds elapsed since January 1st, 1970.
                                                 // PeriodSeconds returns the amount of seconds per each candle for the timeframe you're currently on. Ex: M1 Timeframe = 60 seconds
                                                 // To extend the Rectangle passed the currently open candle by 5 candles, we take PeriodSeconds and multiply it by 5,
                                                 // then add it to the time of the cuandle that is currently open (which is Time[0])
From here on out, plug in the values to ObjectCreate. I'll let you figure this part out.
There's a lot of things wrong here.
Before I go any further, you're going to have put in work and make progress on your own and read the documentation, then come back and ask for help when you're truly stuck.
With that out of the way, your first goal should be to know how to create a Rectangle object.
The first thing is I see is that you're using the candle that's currently open, which is probably not your intended behavior.
Eventually, you will want to know how to programmatically determine where a Supply/Demand Zone exists and which two price points of the candle(s) you want to use for the Rectangle.
For now, let's just draw a rectangle from the candle on index 20 (the 21st candle starting from the right side of the chart going left).
From there, grab the information you want from the candle:
Now, let's say you want to extend the rectangle to 5 candles passed the currently open candle
From here on out, plug in the values to ObjectCreate. I'll let you figure this part out.
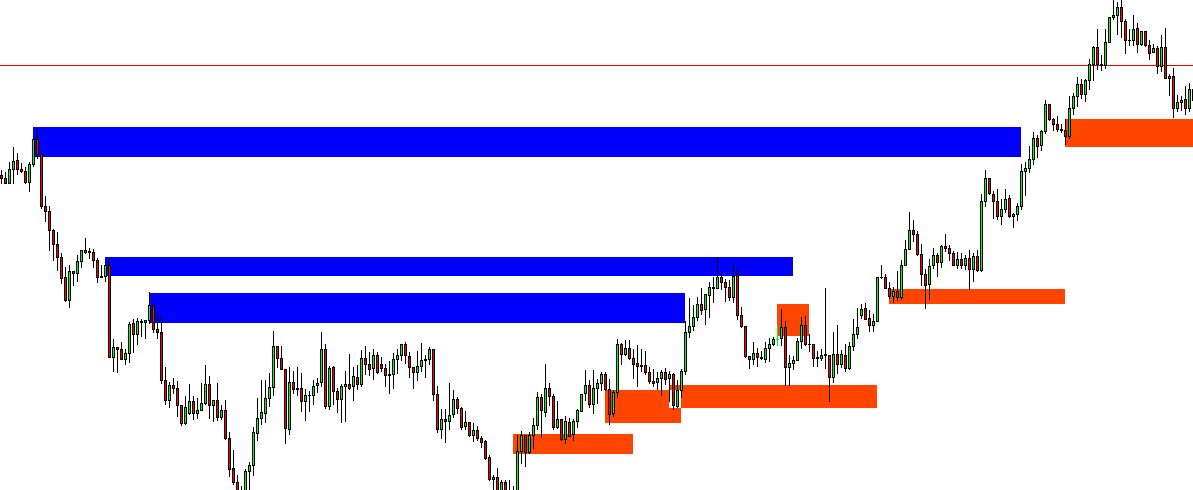
I know how to get Support & Resistance using rectangle, to be more specific this is what I'm Looking for.
I know how to get Support & Resistance using rectangle, to be more specific this is what I'm Looking for.
Hi Jack,
I received your message. To get better support and input, it's best to post here.
I wanted to ask if you know how can i switch my lines from the left to right
There's an issue with your code when creating the Rectangle object. I highlighted it below.
ObjectCreate(0,"Resistance",OBJ_RECTANGLE,0,Time[Resistance],Close[Resistance],0,High[Resistance]);
You used "0" for the second date input. Datetime is measured in seconds elapsed since Jan 1st, 1970. With a value of 0, that means "0 seconds elapsed since Jan 1st, 1970," which means that you're drawing date2 to the very beginning of the chart (technically, you're drawing it to Jan 1st, 1970, but it's rare for data history to go that far back).
I'm guessing you wanted to draw it to the currently open candle on the chart. The correct syntax is highlighted below.
ObjectCreate(0,"Resistance",OBJ_RECTANGLE,0,Time[Resistance],Close[Resistance],Time[0],High[Resistance]);
Also, make sure to switch that for the other ObjectCreate line you have in your code.
Hi Jack,
I received your message. To get better support and input, it's best to post here.
There's an issue with your code when creating the Rectangle object. I highlighted it below.
You used "0" for the second date input. Datetime is measured in seconds elapsed since Jan 1st, 1970. With a value of 0, that means "0 seconds elapsed since Jan 1st, 1970," which means that you're drawing date2 to the very beginning of the chart (technically, you're drawing it to Jan 1st, 1970, but it's rare for data history to go that far back).
I'm guessing you wanted to draw it to the currently open candle on the chart. The correct syntax is highlighted below.
Also, make sure to switch that for the other ObjectCreate line you have in your code.
- Free trading apps
- Over 8,000 signals for copying
- Economic news for exploring financial markets
You agree to website policy and terms of use
Hi All
I want to create supply & Demand EA & not indicator. The code below will not show rectangle wicks when there are low/high wicks. The EA will show me the current price in rectangles instead of wicks. If you know the problem, please help.