How do I use a custom indicator (VWAP Lite) from an expert advisor?
Have you tried with iCustom?
You don't have to write the indicator to you EA.
You only need to call it.

- docs.mql4.com
But what did you find so special with this indicator? Is like MA...if you plot SMA with a period of 1, you will have your daily vwap daily line.
Similar you can find the settings for other lines also in this indicator.
Have you tried with iCustom?
You don't have to write the indicator to you EA.
You only need to call it.
But what did you find so special with this indicator? Is like MA...if you plot SMA with a period of 1, you will have your daily vwap daily line.
Similar you can find the settings for other lines also in this indicator.
VWAP takes consideration to both the price and the volume, SMA only the price.
Simple Moving Average (SMA) Definition (investopedia.com)
"A simple moving average (SMA) calculates the average of a selected range of prices, usually closing prices, by the number of periods in that range."
Volume-Weighted Average Price (VWAP) Definition (investopedia.com)
"The volume-weighted average price (VWAP) is a trading benchmark used by traders that gives the average price a security has traded at throughout the day, based on both volume and price. VWAP is important because it provides traders with insight into both the trend and value of a security."
This is how far I got with the OnTick() function in my expert advisor:
void OnTick(){
      double VWAP_Buffer_Daily[];
      int start_pos=0,count=3;
      ArraySetAsSeries(VWAP_Buffer_Daily,true);
      CopyBuffer(IndicatorHandle,0,start_pos,count,VWAP_Buffer_Daily);
      //Print("OnTick, VWAP_Buffer_Daily[0] ", VWAP_Buffer_Daily[0]);   // Test print
}
It seems to return the right numbers. But it does not draw a chart. Does anyone know what code I need to add in order to do that?
gives the average price a security has traded at throughout the day, based on both volume and price.
be careful: this volume should be distinguished by buy- or sell- volume -- in order you could trust this info... but in MT you do not have such volume division
 from an expert advisor?")
- 2021.09.15
- www.mql5.com
I use iCustom to get a handle to the indicator in OnInit(). . And I use mql5, not mql4.
What is that "handle"? You want to use this indicator in your EA correct?
You need to call indicator buffers in your EA. You do that using iCustom, NOT the way you did it.
#property indicator_buffers 3
you have 3 buffers, you have to call them individually.
   SetIndexBuffer(0,VWAP_Buffer_Daily,INDICATOR_DATA);
   SetIndexBuffer(1,VWAP_Buffer_Weekly,INDICATOR_DATA);
   SetIndexBuffer(2,VWAP_Buffer_Monthly,INDICATOR_DATA);
These are the buffers.
I am not sure, but I believe that iCustom works the same way in mql5 also. MQL5 is like a customized mql4, and both of them the have the core in C++...
VWAP takes consideration to both the price and the volume, SMA only the price.
Simple Moving Average (SMA) Definition (investopedia.com)
"A simple moving average (SMA) calculates the average of a selected range of prices, usually closing prices, by the number of periods in that range."
Volume-Weighted Average Price (VWAP) Definition (investopedia.com)
"The volume-weighted average price (VWAP) is a trading benchmark used by traders that gives the average price a security has traded at throughout the day, based on both volume and price. VWAP is important because it provides traders with insight into both the trend and value of a security."
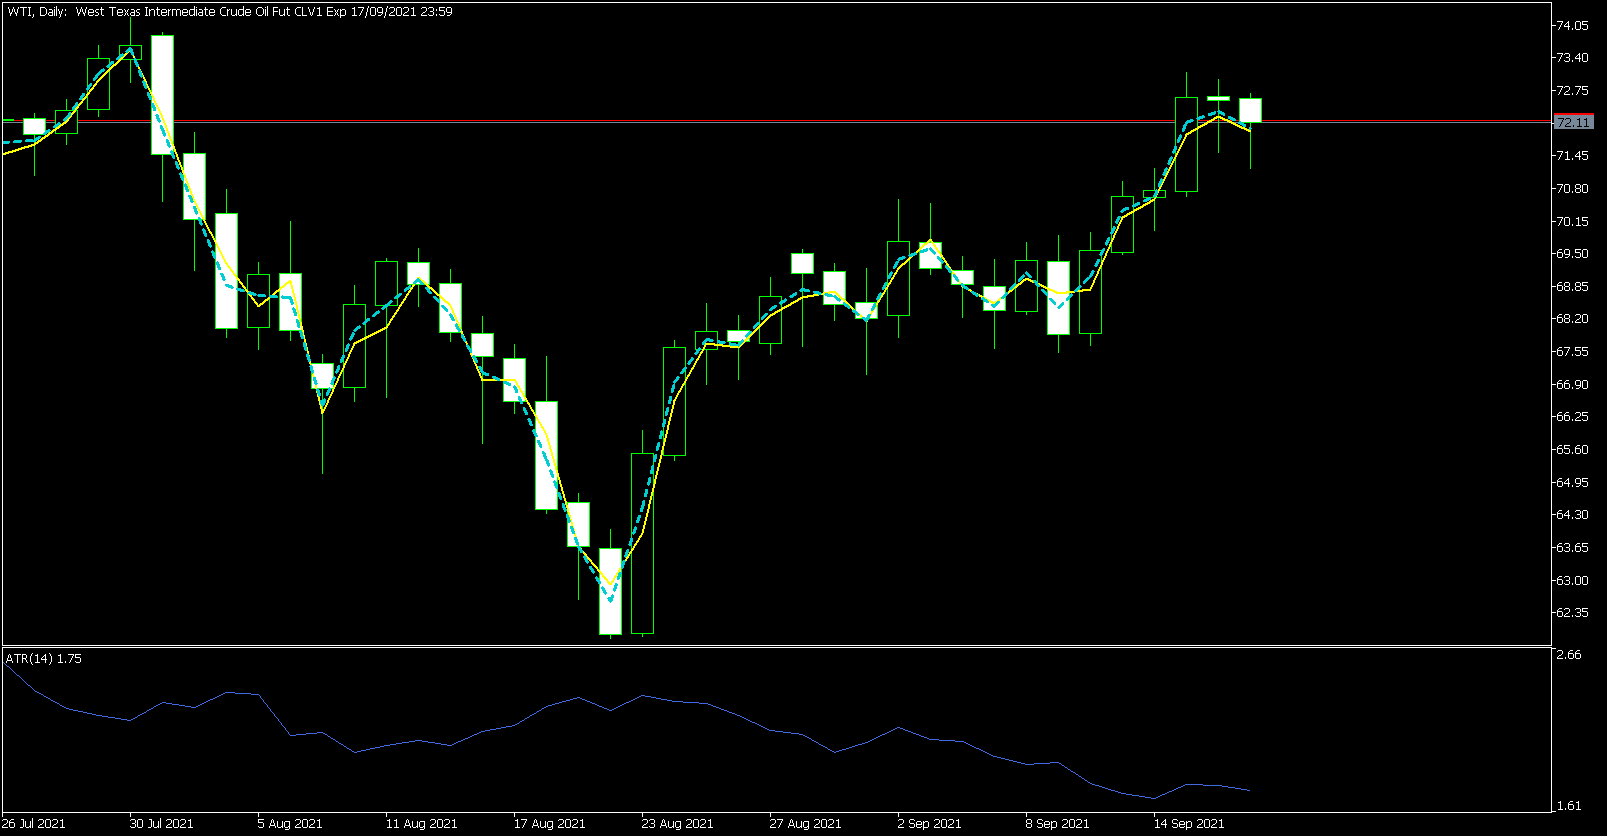
Ok I understand. Just for your own experience, put this indicator on the chart with daily range, and put also EMA with period of one. Both of them on a daily timeframe
Yellow line is 1 period SMA on median price, blue line is you indicator daily.
As JeeyCi said. MT cannot separate sell/buy volume and NOT to be confused with volatility.
As a suggestion : don't look for indictors like swiss army knifes.. which they do a lot of things , but every thing is doing is very poor quality.. :)
- Free trading apps
- Over 8,000 signals for copying
- Economic news for exploring financial markets
You agree to website policy and terms of use
This is how far I got with my expert advisor: