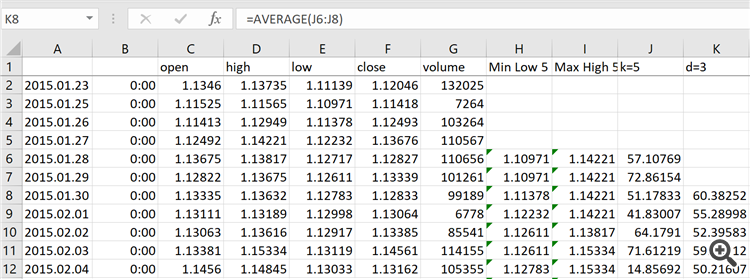
Georgios Kourogiorgas: So the question is why is it populated on the 7th bar and not the 5th?
You can't create an n period moving average until you have at least n values. So it can't create the signal line until it has 5+3 bars. 1/23 through 1/30 is 8 bars. Exactly what your spreadsheet shows.
William Roeder:
You can't create an n period moving average until you have at least n values. So it can't create the signal line until it has 5+3 bars. 1/23 through 1/30 is 8 bars. Exactly what your spreadsheet shows.
You can't create an n period moving average until you have at least n values. So it can't create the signal line until it has 5+3 bars. 1/23 through 1/30 is 8 bars. Exactly what your spreadsheet shows.
Thanks for the reply.
If I am not mistaken Main refers to %K so with k=5 then I need 5 bars (in the chart starts at the 7th)
Then signal refers to %D and with d=3 as in the excel should start at the 7th
The above agrees with the excel (columns j and k)
Is there something else I am missing?
You are missing trading opportunities:
- Free trading apps
- Over 8,000 signals for copying
- Economic news for exploring financial markets
Registration
Log in
You agree to website policy and terms of use
If you do not have an account, please register
I am trying to understand the working under the hood of iStochastic. I loaded the native MT4 stochastic oscillator on a EURUSD D1 chart on an MT4 terminal from IG (IG demo account). I also downloaded the same data from history in excel
Finding number 1:
With below settings:
I can see that the Main (K) is populated from 2015-01-30. The first date in the chart is 2015-01-23. So the question is why is it populated on the 7th bar and not the 5th?
Same for signal. It is populated from 2015-02-03, which is the 10th bar, when it should be starting from the 7th bar, like below (I attach the excel along with two columns along with slow=2):

The numbers in the excel match the numbers on the chart although starting at a later bar
Can anyone explain why? There is not any kind of shift from my part
Finding number 2:
When I set slow =2 I expect a 2-day SMA to be applied on the k and d stochastics.
The indicator is populated at the next bar compared to slow=1 (above) but the numbers in my excel don't match. So slow k for 2015-02-01 should be average(j8:j9) = 46.5042 but the chart says 47.3303. There is a discrepancy for SIgnal (D) as well.
See excel for more data please.
What am I doing wrong here?