Can someone explain MT4 EMA calulations - why does it start from the first bar??
when using iMAOnArray with less history than MA length, work out how much history you actually DO have, and use that.
e.g.
      int MAPeriodAct = MathMin(MAPeriod, Bars-ix);
      DispBuffer[ix] = iMAOnArray(WorkBuffer, 0, MAPeriodAct, 0, MAMode_0SmaEmaSmmaLwma3, ix);
Thats a hell of a thing to figure out correctly, especially when using limited chart history.
All I wanted to do is create a regular LWMA and draw that line for 500 bars
then do some calculations on that lines values and put the resulting values into iMAOnArray to create an EMA it sounds so simple but I had so many problems with this.
You can easily tell if there is an error, run the indicator on 1 minute chart for a few minutes, then bring up properties box and hit OK. If any of the lines prior to the current bar repositions there is an error, either in the way the history is being calculated or in the way it is calculating the MA's on the live prices.. I had a hell of a time debugging and correcting those types of errors, in fact I'm still not entirely convinced I got it right.
Thats a hell of a thing to figure out correctly, especially when using limited chart history.
yes you gave me this code
int RangePeriodAct = MathMin(RangePeriod, Bars-ix);
      int ixHH = iHighest(NULL, TF, MODE_HIGH, RangePeriodAct, ix);
      double HiHi = iHigh(NULL, TF, ixHH);
I looked at it but I didnt know how you intended it to be implemented in the code i posted on that other thread ...
I really agree with SDC. I basically wanted to do something a bit similar.
Coming back to my first post: I played a bit more around: it seems only after about 5 times the MAPeriod: that the EMA is stable enough. What I mean: if one later increases the Number of history bars - that there are no real differences.
In the beginning it gets sharply re-adjusted and as such is not useful at all and I had expected that MT4 would blend it out with Set Draw Beginning (not sure if there is a more clearly defined required number of History bars one needs - would be nice)
SDC: I'm not so familiar with MT4: what do you mean by: You can easily tell if there is an error, run the indicator on 1 minute chart for a few minutes, then bring up properties box and hit OK.
I meant to right click on the chart, choose indicator list, double click your indicator to bring up properties dialogue. When you click OK this dialogue it reloads the indicator, watch the indicator lines as you do this, I think if they reposition before the current bar it might mean there is an innacuracy in there somewhere. I am not entirely sure about that with EMA, it definately is true with LWMA and SMA but the characteristics of an EMA might mean it would reposition slightly depending on where it started from ....
Anyway this is how i think it should be done I'm not 100% sure it is correct though maybe someone who knows for sure will take a look at this.
Using 50 Bar History 10 Periods MA and 20 periods iMAOnArray() EMA
Should create a Blue LWMA 20 bars longer that the required 50 Bar history and a Red EMA of exactly 50 Bars history so you could then use SetIndexDrawBegin() to hide the extra length on the first MA and make both lines show 50 bars history (plus the currently forming zero bar)
Test Example Indicator draw LWMA then use iMAOnArray to create an EMA of the LWMA
//+------------------------------------------------------------------+
//|                                                 OnArrayTest1.mq4 |
//|                                              Copyright© 2011 SDC |
//|                                    https://www.mql5.com/en/users/sdc |
//+------------------------------------------------------------------+
#property copyright "Copyright© 2011 SDC"
#property link      "http://https://www.mql5.com/en/users/sdc"

#property indicator_chart_window
#property indicator_buffers 2
//---- draw settings                    //---- user inputs ----+
#property indicator_color1 SteelBlue    extern int MA_Period=10;
#property indicator_width1 2            extern int Onarray_Period=20;
#property indicator_color2 Red          extern int MaxHistory=50;
#property indicator_width2 2

//---- indicator buffers ----+          //---- counting array ----+
double Buff1[];                         double Counter[];
double Buff2[];
//---- newbar detection ----+
datetime time;
//+------------------------------------------------------------------+
//| Custom indicator initialization function                         |
//+------------------------------------------------------------------+
int init()
  {
//---- indicators
   SetIndexBuffer(0,Buff1);         SetIndexStyle(0,DRAW_LINE);
   SetIndexBuffer(1,Buff2);         SetIndexStyle(1,DRAW_LINE);
//---- array settings
   ArraySetAsSeries(Counter,true);
   ArrayResize(Counter,MaxHistory+Onarray_Period);
//---- initialize newbar time
   time=Time[0];
//----
   return(0);
  }
//+------------------------------------------------------------------+
//| Custom indicator iteration function                              |
//+------------------------------------------------------------------+
int start()
  {
   int   i,j,limit,pos;
   int   counted_bars=IndicatorCounted();
//---- draw lwma
   limit=Bars-counted_bars-1;
   if(limit>MaxHistory+MA_Period)                 //make sure history
    {limit=MaxHistory+Onarray_Period;             //includes enough bars
    }                                             //for MA calculations
   for(i=limit;i>=0;i--)
    {Buff1[i]=iMA(Symbol(),0,MA_Period,0,MODE_LWMA,PRICE_HIGH,i); //draw lwma
    }
//---- check for new bar ----+
   if(time!=Time[0])                              //if there is a new bar
    {ArrayResize(Counter,ArraySize(Counter)+1);   //detected increase array
     pos=ArraySize(Counter)-1;                    //size by one and move all
     for(j=pos;j>=2;j--)                          //except the zero index
      {Counter[j]=Counter[j-1];                   //one position up array
      }
     time=Time[0];                                //reset time to current
    }
//---- fill array
   for(i=limit;i>=0;i--)                  //copy values from drawing
    {Counter[i]=Buff1[i];                 //buffer to array
    }
//---- onarray Loop ----+;
   if(limit==MaxHistory+Onarray_Period)   //change limit to use
    {limit=MaxHistory;                    //original history size for
    }                                     //drawing OnArray EMA
   for(i=limit;i>=0;i--)
    {Buff2[i]=iMAOnArray(Counter,0,Onarray_Period,0,MODE_EMA,i);
    }
//----
   return(0);
  }
//+------------------------------------------------------------------+
I resize the array each time there is a new bar to make it bigger I'm not sure did I really need to do this ?
Thanks SDC.
From my manual checks I need at least more than 4 MA Periods to get a stable EMA.
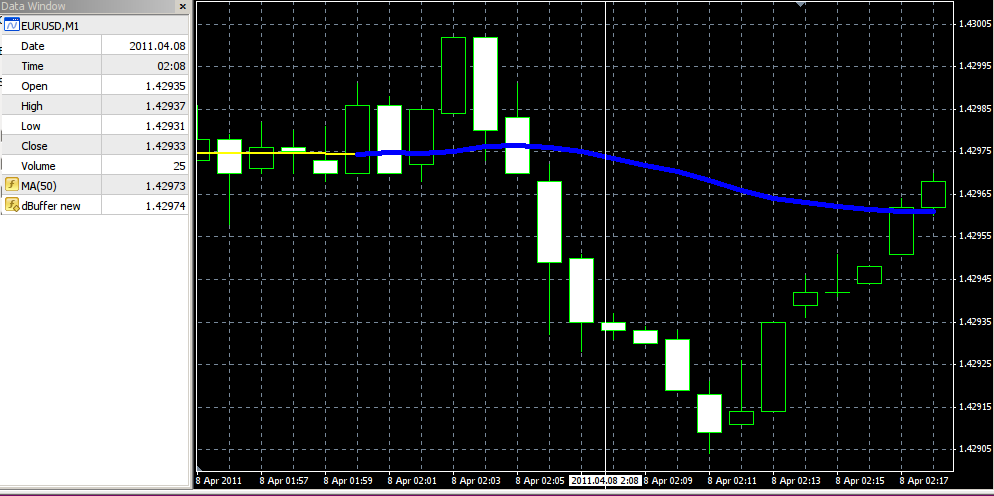
The picture below uses a pre span of 3 Times the EMA Period and one still sees slight discrepancies in the data window.
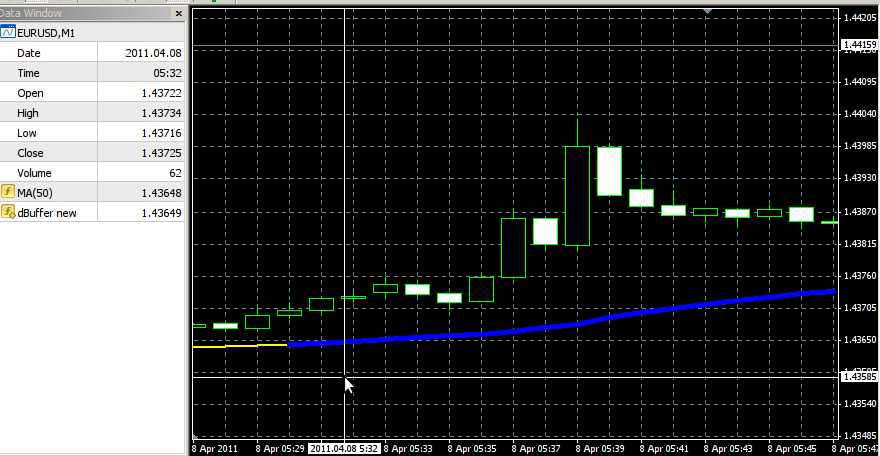
The picture below uses a pre span of 4 Times the EMA Period and one still sees slight discrepancies in the data window.
- Free trading apps
- Over 8,000 signals for copying
- Economic news for exploring financial markets
You agree to website policy and terms of use
I would like to understand why does MT4 draw an EMA line from the very First bar.
I always thought like other MA's there must be some calculation points before the first EMA is finally calculated.
Look at the pic below:
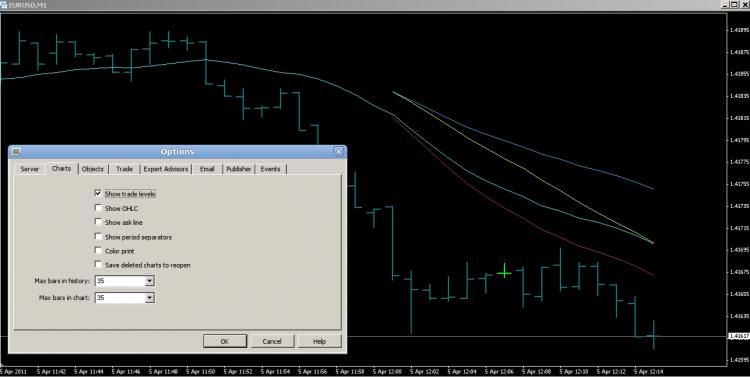
I reduced on purpose the Bars in the Chart to 35 so to see all there is: applied are Mas(21) all 4 MT4 types.as you see only the Aqua (EMA) start from the very first point.
According to other resources The first EMA should be starting later.
http://fxtrade.oanda.com/learn/forex...moving-average ( you are calculating your first EMA value where there is no previous day’s EMA, use SMA instead.)
http://stockcharts.com/school/doku.p...oving_averages
(An exponential moving average (EMA) has to start somewhere so a simple moving average is used as the previous period's EMA in the first calculation.)
Mainly I'm asking because I tried iMAOnArray with only a selected numbers of bars.
Thanks