Problem making indicator disappear from the chart
-
for(int i=start; i<rates_total && !IsStopped(); i++)
You are processing indexes as non-series. You never set your buffers to non-series before adding values.
Your code for(int i=start; i<rates_total && !IsStopped(); i++) { if(draw_switch) //setting all the horizontal line values to be same as last value of MA buffer MAHorizontalLine[i] = MABuffer[rates_total-1]; else MAHorizontalLine[i] = EMPTY_VALUE; }
Simplified if(draw_switch) for(int i=start; i<rates_total && !IsStopped(); i++) { MAHorizontalLine[i] = MABuffer[rates_total-1]; }
-
   if(prev_calculated==0)
      start=0;
   else
      start=prev_calculated-1;
None of this is necessary if you return the proper value.
How to do your lookbacks correctly #9 - #14 & #19
@William Roeder, this is not the MQL4 section. MQL5 by default treats buffers as non-series.
-
You are processing indexes as non-series. You never set your buffers to non-series before adding values.
Your code Simplified -
None of this is necessary if you return the proper value.
How to do your lookbacks correctly #9 - #14 & #19
Thank you so much william for your reply.
I set the arrays as non timeseries and tried the simplified code but no change still facing the same problem
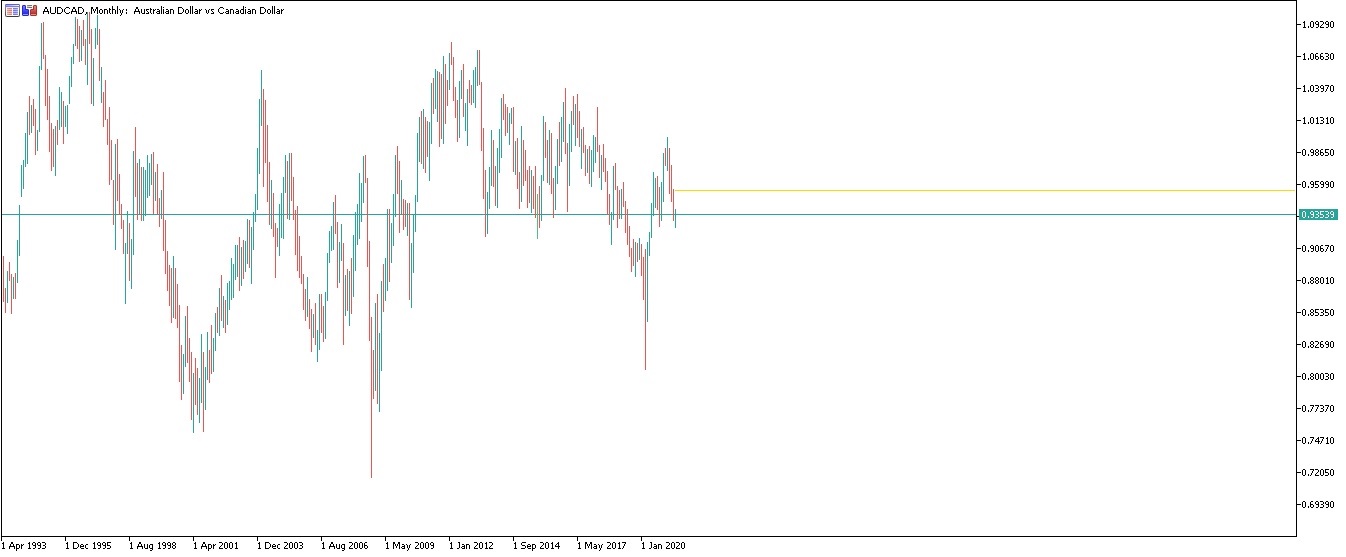
also I faced another issue I'm trying to draw the horizontal line of the daily moving average as described in the code, I added the monthly line too (same as the daily and added its own switch).
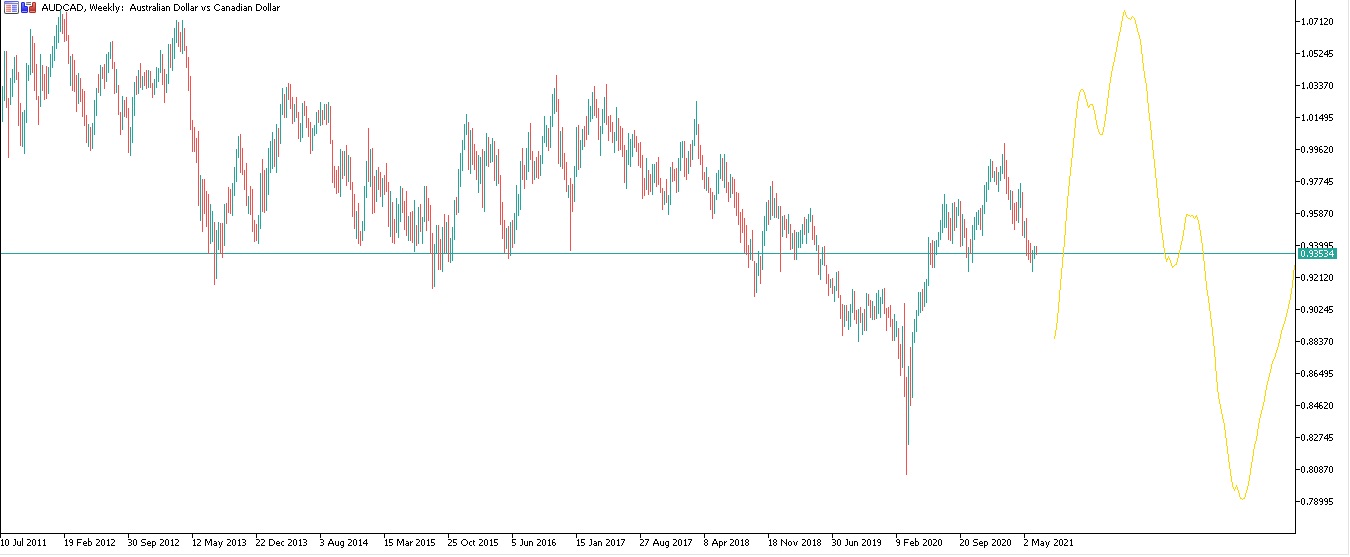
But when I move to the smaller time frames (4hrs or below)the lines get so weird and messed up I tried a lot of different ways of debugging but I don't know what might be wrong.
Your help is truly appreciated.
The first photo shows how the horizontal line of monthly moving average is drawn on the chart when on the monthly timeframe. and the second one shows what happens when I move to weekly or any lower timeframe
- Free trading apps
- Over 8,000 signals for copying
- Economic news for exploring financial markets
You agree to website policy and terms of use
Hello Folks,
I'm making an indicators that draws Daily Moving average and a horizontal line at the value of the last bar of the moving average
I made a boolean variable (switch) for each line to control when both lines should be drawn (when the value of the switch =True then draw the lines on the chart, when the value is false the indicator should disappear)
The problem is when the switch value is false,I tried to set the indicator value to be EMPTY_VALUE or ZERO but the indicator doesn't disappear from the chart
Any idea how to solve this problem or what I'm doing wrong?
Help is really appreciated!