Check out this code: OHLC and indicators to CSV Panel
Utility idea
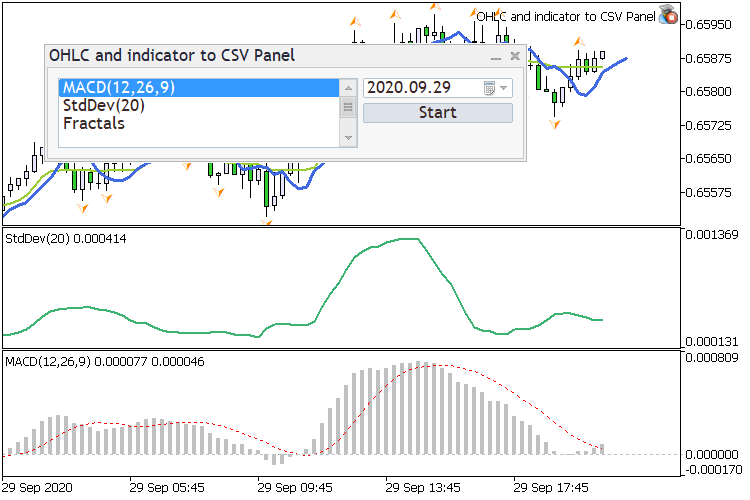
This is the first version of the utility in the form of a panel: the panel finds and displays all indicators on the chart. The start date is selected in the calendar field. After clicking on the 'Start' button, the following fields are written to the csv file: 'Date', 'Open' 'High', 'Low', 'Close', 'Buffer # 0'. Please note that data from buffer # 0 is taken from the selected indicator and the recording precision is equal to Digits ().

Fig. 1. OHLC and indicators to CSV Panel
The presence of indicators is scanned every 10 seconds.
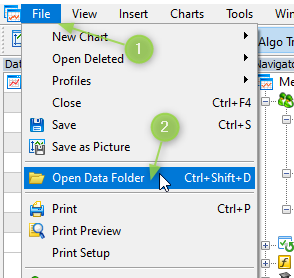
Thanks a lot Vladimir. One stupid question though: after I click "Start", where do I find the CSV data?
In the [Data Folder]\MQL5\Files

Thanks a lot again, Vladimir. Wish you an awesome weekend.
Thank you for your question, I have added and expanded the description of the script (now the description says where to find the saved file).
- Free trading apps
- Over 8,000 signals for copying
- Economic news for exploring financial markets
You agree to website policy and terms of use
I am studying some charts and, to make things easier, I'd like to export the prices/values of moving averages for Excel (or any other format).
All I need is the price at specific time periods throughout the day. For instance:
Time Price
9:05 50,649
9:10 50,820
9:15 50,540
Is that possible?