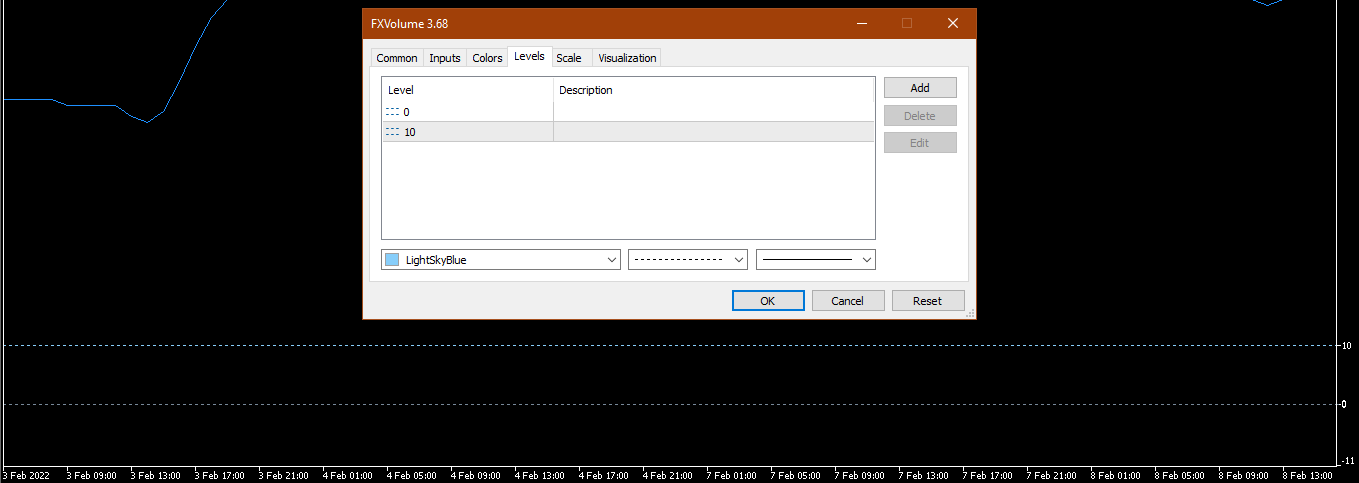
Custom Indicator showing ZERO level, though not defined anywhere in the code
Actually it's buggy, as this automatic 0 line doesn't respect what is defined in the code (style, color...).
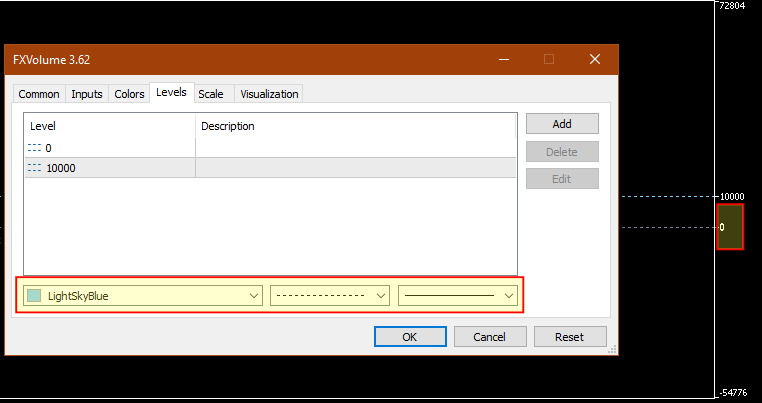
It might be related to setting the number of indicator levels twice in OnInit() — first
IndicatorSetInteger(INDICATOR_LEVELS,3); // Sets No of levels in the indicator window
and then
IndicatorSetInteger(INDICATOR_LEVELS,2);
Perhaps one is left orphaned instead of being deleted.
As designed. It is not level. It is grid.
Because it is important to see pass from + to - and vice versa
As designed. It is not level. It is grid.
Because it is important to see pass from + to - and vice versa
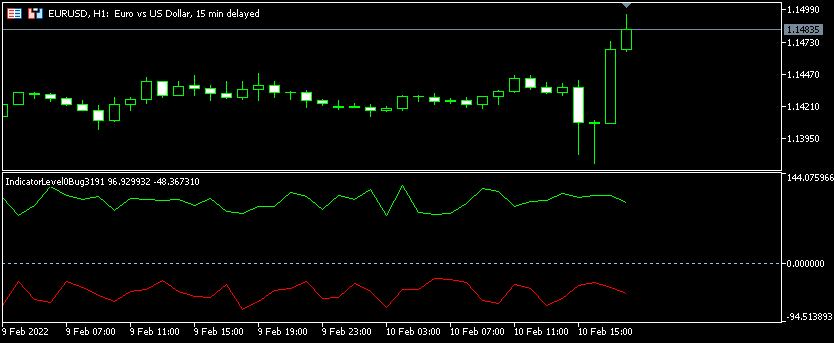
As a grid its should be in the background and not disable or hide a level.
An explicitly defined level 0 should have priority to a grid, see the screenshot, the indicator level 0 is not shown at all.
So beside the bug fixed as Ilyas reported, there is an other bug when the grid is on.
As a grid its should be in the background and not disable or hide a level.
An explicitly defined level 0 should have priority to a grid, see the screenshot, the indicator level 0 is not shown at all.
So beside the bug fixed as Ilyas reported, there is an other bug when the grid is on.
Almost fixed in build 3191.
It remains a bug as I warned about it. To reproduce :
1 - On a chart, without a grid, attach the provided indicator. All is displayed correctly.
2 - Enable the grid. (CTRL+G or click on button...). The Level 0 line is NOT displayed. This is a bug. Disable the grid again, the level is shown.
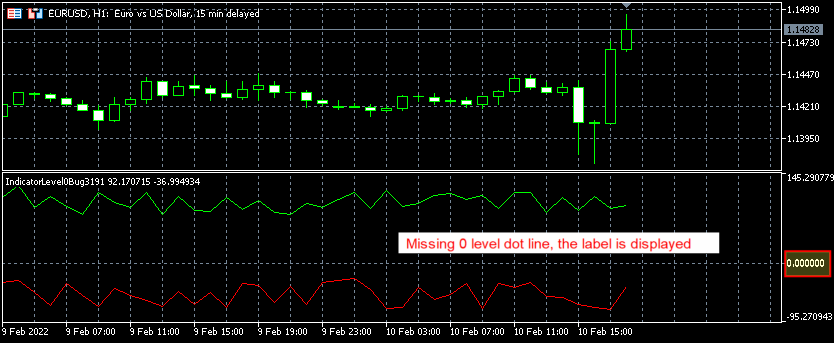
The problem is the grid is not in the background. If you are using a dot line level it's BEHIND the grid, that's not correct. If you set a solid line it's shown as the grid can't mask it completely. A level should have priority on a grid.

- Free trading apps
- Over 8,000 signals for copying
- Economic news for exploring financial markets
You agree to website policy and terms of use
Custom Indicator showing ZERO level, though not defined anywhere in the code