Strategy Tester with Optimization mistery
You are missing trading opportunities:
- Free trading apps
- Over 8,000 signals for copying
- Economic news for exploring financial markets
Registration
Log in
You agree to website policy and terms of use
If you do not have an account, please register
Hello,
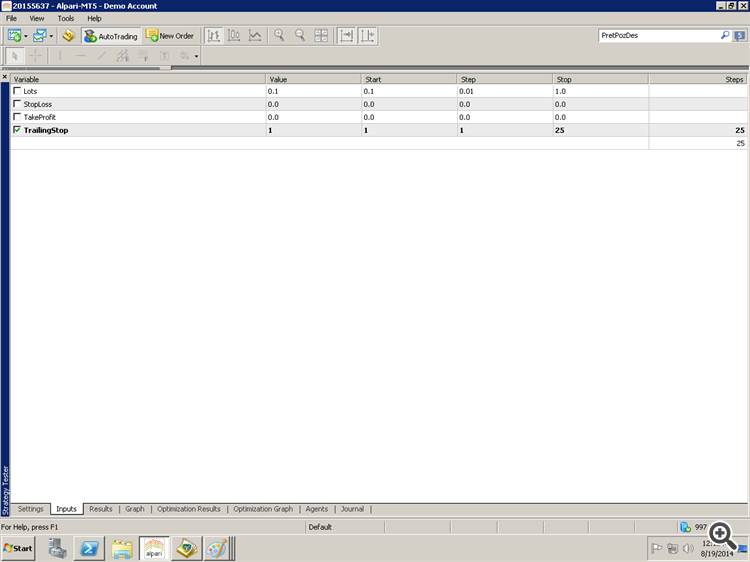
I was trying to find the best results (in terms of profits/loses) of an EA with a variable "TrailingStop" that takes values from 1 to 25 with 1 step increment (see attached picture "Inputs").
I am dazed and confused -like in Led Zepellin's song- about the results. I do not understand how "Results" page figures are calculated.
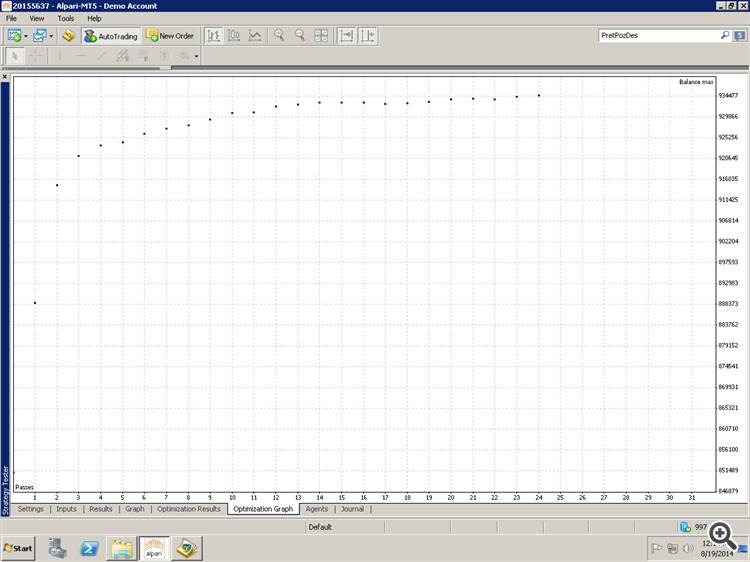
"Optimization Results" and "Optimization Graph" are OK; they related to each other, I mean that the "Optimization Graph" represents "Optimization Results" (or vice versa if you like).
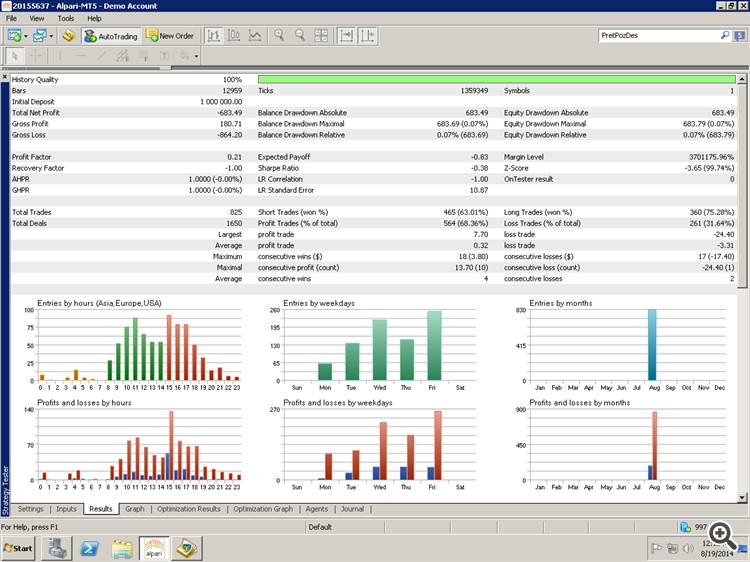
But how "Results" figures can be interpreted ?.
For me this page has no relation neither with "Optimization Results" nor with "Optimization Graph".
I don't understand for what value of variable "TrailingStop" are those results. I do not see a profit of -683.49 (as it is shown in "Results" page) in "Optimization Results" or in "Optimization Graph" page.
PS: Settings for Optimization are: "Slow complete algorithm" "Balance max"
So what is the interpretation of page "Results"