EA optimization interpretation
You are missing trading opportunities:
- Free trading apps
- Over 8,000 signals for copying
- Economic news for exploring financial markets
Registration
Log in
You agree to website policy and terms of use
If you do not have an account, please register
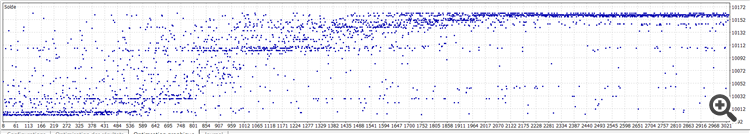
Hi everyone,
So I'm currently trying to optimize my EA that was running okay, and I don't really know how to interprete the data that is shown, I red an article about the optimization but nothing that is helping me, also I've been using "open price" only to get more data faster. But here is the thing : I have this graph but I don't know what it means (well I know its the money that the EA made) but It's interesting to see how It's optimized I guess, If someone could help me out here, I'm attaching the pics